| # Learning to Read GPU Frame Captures |
| |
| This is a gentle introduction to learning how one may go about reading a GPU |
| frame capture. This would be using a tool like the [Xcode GPU Frame |
| Debugger](https://developer.apple.com/documentation/metal/frame_capture_debugging_tools?language=objc), |
| [RenderDoc](https://renderdoc.org/), or [Android GPU |
| Inspector](https://gpuinspector.dev/). If you are already comfortable using one |
| or all of these tools, this introduction is likely too rudimentary for you. If |
| so, please skip this. |
| |
| If you are working on Impeller (or any low-level graphics API for that matter), |
| it is unlikely you are going to get any work done without a frame debugger. |
| Fortunately, it is also extremely easy and fun. But it does require learning a |
| new skill-set. |
| |
| I liken getting proficient at graphics debugging to learning how to drive. It is |
| absolutely a skill-set that must be learned. And, you get better at it the more |
| you practice. |
| |
| The car you choose to learn to drive on really doesn’t matter. It may be gas or |
| electric, stick-shift or automatic. Admittedly, some cars are easier to learn to |
| drive on than others. But again, the car isn’t the point. The same holds for |
| graphics debuggers and the client rendering APIs. If you can read a GPU Frame |
| capture of a Vulkan frame on Windows using RenderDoc, you should be quickly able |
| to read a trace for a Metal Frame on iOS using Xcode. In fact, in a |
| cross-platform framework like Impeller, it is unlikely you are going to be able |
| to get away with using just one debugger. Like cars, all of them have their own |
| quirks and use-cases with no one-size-fits all solution. |
| |
| # Start in an Empty Parking Lot |
| |
| You wouldn’t start learning to drive on a busy freeway or city street. So, if |
| you immediately open a frame trace of a very complicated application, you are |
| likely to get overwhelmed. |
| |
| Start with a frame that renders absolutely nothing. You are only figuring out |
| what the pedals in the car are and what the gauges mean. We are going to be |
| using Xcode in this tutorial in case you are following along. But again, the car |
| doesn’t matter. |
| |
| Make sure you have already set up an Xcode session by following the instructions |
| in the wiki. Setup a test that opens a blank playground. With the playground |
| running, click on the stylized `M` to capture a Metal frame. |
| |
|  |
| |
| Give Xcode a few seconds to capture the frame and show the frame overview. |
| |
|  |
| |
| Let’s figure out what the gauges of this car mean. |
| |
| * In box `4`, the overview shows that there are no draw calls and one command |
| buffer with one render command encoder. This is for the playground to render |
| the blank screen with the clear-color. |
| * The playground renders a dark slate gray clear color as it was adequately |
| contrasty with the primary colors and also black and white. |
| * Box `2` shows the Metal calls made grouped by the API call. If you click on |
| the Group by API Call dropdown, you can group the calls made according to the |
| pipeline state. But we have no draw calls remember, so this will be empty. |
| But, realize that in a more complicated application where you are looking for |
| a single class of draw calls, viewing by the pipeline state is going to be |
| more useful. |
| * When grouping by the API call, absolutely all calls made to the Metal API will |
| be shown in the sidebar. Most of them are not particularly interesting. These |
| include calls to allocate memory, create command buffers, set labels, etc.. To |
| whittle down this list to a (potentially) more interesting subset, click the |
| little flag at the bottom (see box `8`). But, if you ever find a call you were |
| looking for is not present in the sidebar, you may have filtered it away. |
| * Box `5` shows frame performance. But there is nothing to show as we are not |
| rendering anything. We’ll come back to this later. |
| * Box `6` shows the graphics memory overview. We’ll revisit this in detail later |
| too. But, it is a good idea to see what memory rendering a blank slate needs. |
| Realize that all graphics memory is not equal and learning when to use one vs |
| the other can lead to some interesting performance improvements. |
| * Box `7` is Xcodes attempt at showing you how you can improve performance. |
| These are just insights though and not warnings or errors. But, in every |
| frame, try to understand and reason about each insight to see if action is |
| necessary. In most cases, you can address these insights fairly easily. In the |
| example above, there are three insights. Lets reason about them: |
| * There are two insights for the late creation of two textures. From the |
| names of the textures, you can tell that one is the texture used for the |
| stencil buffer and another the color texture used for the 4xMSAA resolve |
| step. Impeller uses memory-less textures for those on iOS and the |
| playground is running on Mac. So it hasn’t bothered to create and reuse |
| textures in the playground runner. But, it should. And Xcode’s point that |
| texture allocations should not occur in a frame workload is well made. |
| Advice that is universally prudent when working on Impeller. |
| * The last insight is that the main render pass is empty. Well, no shit, |
| Sherlock. We won’t have this concern in a real application. The playground |
| will always render frames over and over specifically so that a frame |
| debugger can capture a frame. Even if nothing is in that frame. This won’t |
| be a problem in Flutter where no frame will be rendered if nothing |
| changes. |
| * Notice that we could immediately tell what the two textures that were |
| created late were for. This is because all GPU objects in Impeller have |
| the ability to be labelled. In fact most APIs in Impeller make it very |
| hard to create unlabelled objects. If you notice an object that is not |
| labelled, file a bug to label it. Better yet, find and label it yourself. |
| Building for easier instrumentation must be done diligently and |
| proactively. And it is your responsibility! |
| * Box `1` is the nav stack that you will use often and is unreasonably effective |
| in Xcode relative to other debuggers. It’s a good idea to remember its key |
| binding (mine is ctrl+cmd+arrow). If you click on something and find yourself |
| lost, go back to a known point (usually the summary). |
| * Box `3` highlights an `Export` button. This allows you to export a GPU trace. |
| But, realize that whoever views a GPU Trace needs to have identical hardware. |
| The traces are also rather large. So, in a single debugging session, you |
| should store these traces locally so you can check how your iterations are |
| affecting the frame. But you may not find sending these to others super |
| useful. |
| |
| Before we trace anything more complicated, let’s take a look at the memory usage |
| in the playground. |
| |
| # Memory Overview |
| |
| Click on the `Show Memory` button in Box `6` from the previous section. We are |
| still not rendering anything in the playground. |
| |
| An overview of all graphics memory usage is shown. |
| |
|  |
| |
| Along with all the objects that occupy memory, their locations in different |
| memory categorizations are also shown. Notice how the totals all add up to the |
| same number. This is useful in cases where you forgot to assign the optimum |
| memory storage mode for textures or buffers (private, managed, or memory-less). |
| |
| You can double click an object to inspect it and highlighting a texture should |
| give you a preview of its contents. |
| |
|  |
| |
| Do not underestimate the usefulness of filtering the results either by category |
| name or resource name. You can filter by category by selecting the small |
| circular callstack button next to the category. When you apply filters, the |
| memory totals will update to reflect just filtered items. Here, there is 3 MB of |
| device memory for managed textures. |
| |
|  |
| |
| You can also apply freeform text filters to the resources using the text field |
| highlighted by the second box. This is used by multiple Impeller subsystems. For |
| example, offscreen textures that are used within a frame between multiple |
| render-passes are named such that they can be easily filtered. So, if you wanted |
| to estimate the memory overhead of such render-passes (say you are working on |
| optimizations to elide these), you can easily tell using a simple text filter. |
| |
| This also highlights the importance of always naming all GPU resources. Again, |
| if you find an unnamed resource in this view, file a but to have it be tagged or |
| [tag it yourself](#finding-where-api-calls-were-made-in-the-codebase). |
| |
| The “Time Since Last Used” is useful in catching potential memory leaks as |
| allocations not referenced for multiple frames must typically be collected to |
| save memory. Flutter applications typically have tons of these as its image |
| caches reference images that aren’t used for a while. If these are tagged |
| correctly (which they should be), they can be filtered away. That way, you can |
| focus on leaks in specific subsystems without having “cached” items confuse the |
| memory view. |
| |
| # Driving on the Street |
| |
| So we’re comfortable with the car in the parking lot and we know what all the |
| gauges and pedals do. Let’s drive this car onto a quiet street. |
| |
| Let’s render a scene that actually renders something. But, let’s just render a |
| solid red triangle in the playground. |
| |
|  |
| |
| We notice two changes in the overview. |
| |
| * When grouping the calls by the pipeline state, we see one pipeline listed with |
| one draw call. Since all GPU objects in Impeller are labelled, we see one |
| pipeline aptly called the `SolidFillPipeline` with one draw call. |
| * The `Performance` section in box `5` from the last section is no longer empty. |
| |
| Let’s dive into each of the new sections. |
| |
| ## Inspecting the Pipeline State Object |
| |
| All draw calls use a pipeline state object that specifies the programmable and |
| fixed function elements of the draw call as well as the data referenced by that |
| draw call. |
| |
| The programmable elements of the pipeline state object are defined by shaders |
| that are written on the host and compiled into the engine in an intermediate |
| representation. Vertex shaders are run per vertex in the draw call and fragment |
| shaders run once per texture element in the coverage area of the draw call. |
| |
| There are numerous fixed function elements in a pipeline state object. But the |
| major ones Impeller typically must configure are blend modes (i.e, how the new |
| texture element must combine with items already in the framebuffer), sample |
| counts for resolve (used in MSAA), pixel formats of its various attachments, |
| etc.. |
| |
| Pipeline state objects are immutable. So, if either the programmable or fixed |
| function element of the object needs to be modified, a new variant must be |
| created. |
| |
| So, if you see multiple instances of a named pipeline in the grouping of calls |
| by pipeline state, realize that it is a different variant of a prototype |
| pipeline state. If these are not named appropriately and you can’t tell the |
| difference, file a bug to disambiguate them or [tag them |
| yourself](#finding-where-api-calls-were-made-in-the-codebase)! |
| |
| Let’s click on the `SolidFill Pipeline` in the example to analyze that pipeline. |
| All draw calls listed below that pipeline use the same programmable and fixed |
| function pipeline configuration. |
| |
|  |
| |
| You will get intimately familiar with this view when you set up a new pipeline |
| state object in Impeller or try to reason about the correctness of one of the |
| pipeline state object variants. |
| |
| In this example, we can tell that all draw calls with this pipeline state have |
| blending enabled with the given blend mode and work on images with `BGRA8Unorm` |
| pixel format. The draw call can also expect a stencil buffer. |
| |
| Clicking on either the vertex or fragment shader should show the equivalent |
| Metal source code for the GLSL shader written in Impeller. This Metal source |
| code (and the shader debugger) is only available in debug and profile modes. |
| When GLSL shaders are written in Impeller, they are converted into intermediate |
| representation for packaging with the engine. However, since debugging shaders |
| is such a useful exercise, the shader compiler will also compile the GLSL |
| shaders into Metal source code and then package it with the debug or profile |
| engine alongside the intermediate representation that is actually used. That |
| way, the Xcode frame debugger can find that code when you ask to debug the |
| programmable elements of the pipeline. |
| |
| We'll go into using the shader debugger later. But, now you know how to inspect |
| a pipeline. |
| |
| ## Inspecting a Single Draw Call |
| |
| Each draw call must reference a pipeline state (that we already know how to |
| inspect) and provide references to the data used by that draw call (like vertex |
| and uniform buffers, attachments) along with metadata about it (like primitive |
| topology). |
| |
| To inspect how each draw call is configured, select the call in the sidebar. |
| |
|  |
| |
| To get an overview of the draw call, the Bound Resources section is the most |
| useful view. Let’s ensure we understand each item. |
| |
| The `Pipeline States` section we have already [covered in |
| detail](#inspecting-the-pipeline-state-object). |
| |
| In the `Vertex` section, the `Geometry` lists how each vertex is transformed by |
| the vertex shader. |
| |
|  |
| |
| Here, you see how each vertex (three here since we are rendering a triangle) is |
| transformed by the shader such that it ends up in the correct spot in normalized |
| device coordinates. In this particular case, the solid color seems to be |
| presented to the vertex shader in a uniform with the shader passing it along to |
| the fragment stage as an output. An improvement could be to present the uniform |
| directly to the fragment stage. Impeller may have done this because only a |
| single uniform buffer for all stages was easier to set up. |
| |
| You can double click on any buffer in the `Bound Resources` section to dump |
| information about that buffer presented in a view appropriate for that stage. |
| When I double click the buffer containing the uniform data, the following view |
| is shown. |
| |
|  |
| |
| Pay specific attention to the `Row` index. Impeller architecture doesn’t create |
| small individual buffers for uniform data. All uniform data for a single render |
| pass is packed into a single jumbo uniform buffer with each draw call |
| referencing its uniform data at an offset into this larger buffer. This allows |
| Impeller to avoid small allocations and use a simpler and faster bump allocator. |
| Here, it looks like the uniform data is towards the end of that jumbo buffer as |
| noted by the negative indices present in the view. The data at negative indices |
| is interpreted as garbage when viewed through the lens of the uniform data |
| layout the draw call expects. |
| |
| The other useful item in the `Bound Resources` section is the state of the |
| attachments when the draw call was made. This comes in particularly handy for |
| debugging writes to a buffer that you will never actually see. For instance, the |
| stencil buffers. |
| |
| To demonstrate debugging stencil buffers, I captured a trace of a Fuchsia |
| colored rectangle clipped to a circular shape. You’d never see the stencil |
| buffer so it would be hard to understand how the draw call is affecting it |
| without viewing the attachment in the frame debugger. Clicking on the gear to |
| the right of the buffer label also shows a histogram of the image as well as |
| options to change the color mapping, or, to view values within a certain range. |
| In this simple example, the values in the stencil buffer only range from 0 to 2. |
| So viewing the entire range of values in the stencil buffer would have made the |
| changes in the buffer indiscernible to you. Xcode helpfully selected the “Min to |
| Max” view for us. You can do the same for any attachment. |
| |
| |
|  |
| |
| ## Debugging a Shader |
| |
| The shaders authored in Impeller use [GLSL |
| 4.60](https://www.khronos.org/registry/OpenGL/specs/gl/GLSLangSpec.4.60.pdf). |
| Xcode does not support debugging these shaders natively. To work around this, |
| the Impeller shader compiler will convert those shaders to Metal source code and |
| embed them inside debug and profile mode engine binaries alongside the shaders |
| intermediate representation that is actually used to generate the pipeline state |
| objects. The Metal source code is converted such that it looks as similar to |
| GLSL as possible. |
| |
| You can debug both vertex and fragment shaders. Remember that vertex shaders run |
| once per vertex (three times in the case of our example that renders a simple |
| triangle) and fragment shaders run once per texture element in the coverage area |
| of the draw call (potentially thousands of times depending on the side of the |
| triangle rendered). So, when you want to debug a shader, you must first find one |
| specific invocation of either the vertex or fragment shader to debug. |
| |
| ### iOS & macOS: Tell Xcode the Location of your Shaders |
| |
| When using the Metal backend, instead of packaging shader sources as strings, |
| Impeller compiles and packages them into a single shader library. This library |
| is stripped of debugging information to minimize the size overhead. This |
| debugging information is not tossed away however. In the `out/<variant>/shaders` |
| directory, you will find a series of files with the `.metallibsym` extension. |
| |
| When you try to debug a shader for the first time as described in the sections |
| below, Xcode you prompt you with a dialog that says it can't find the sources |
| for shader along with a button to show it where to find the relevant |
| `.metallibsym` files. Click that button and a dialog will pop up showing the |
| Metal libraries whose `.metallibsym` files could not be resolved. |
| |
|  |
| |
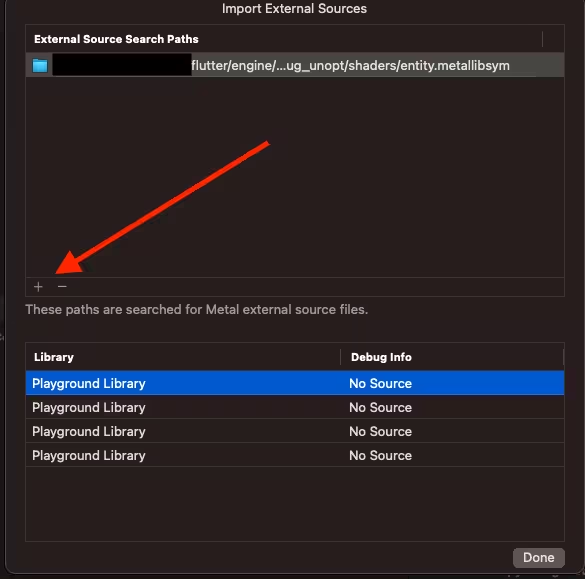
| In the "External Source Search Paths" section, click the tiny `+` button at the |
| bottom. In the file chooser dialog box that appears next, select all the |
| `metallibsym` files in the `out/<variant>/shaders` directory. |
| |
| You will only have to do this once per engine variant. The search paths will |
| remain the same as you rebuild the engine and the `.metallibsym` files contain |
| the UUID of the shader library. So Xcode won't attempt to resolve shaders |
| sources in an outdated `.metallibsym` file. |
| |
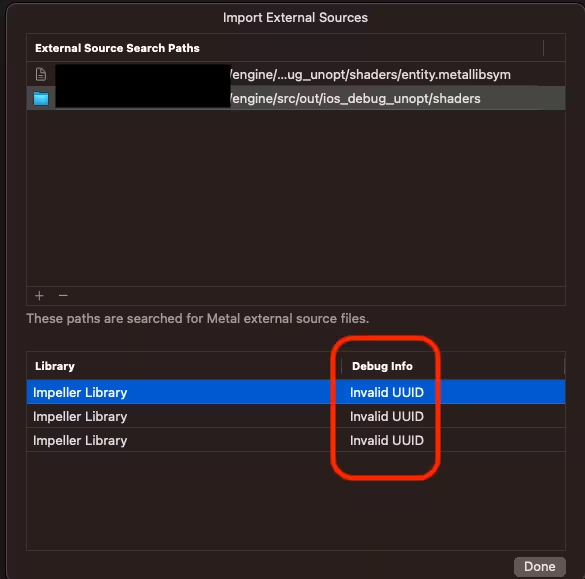
| You may however also run into Xcode complaining about "Invalid UUID" errors. |
| This is instead of the "No Source" errors as shown in the dialog above. |
| |
|  |
| |
| The team has been unable to to find documentation for this type of error. But |
| through trial-and-error, we have determined that the way to fix this is to set |
| the deployment target of the application to the current OS version during the |
| instrumentation run (either on macOS or iOS). To information about this line of |
| troubleshooting can be found [here](https://github.com/flutter/engine/pull/39532). |
| |
| ### Debugging a Fragment Shader |
| |
| Since fragment shaders are run once per texture element in the coverage area of |
| the draw call, it is easiest to find invocations of the fragment shader by |
| opening one of the attachments used by the draw call. |
| |
| Find and open either the color or stencil attachments in the `Bound Resources` |
| section as described in the section on [inspecting a single draw |
| call](#inspecting-a-single-draw-call). |
| |
| |
|  |
| |
| |
| At the bottom right corner of the attachment preview, you will see a disabled |
| `Debug` button with a crosshair to its right. The button is disabled because no |
| texture element is selected for debugging. Click on the crosshair and drag the |
| magnifier on a texture element converted by a draw call. The draw call will be |
| highlighted with a green outline. |
| |
| Once a valid texture element is highlighted, the `Debug` button should be |
| enabled. Click it to debug that one invocation of the fragment shader used by |
| that draw call. |
| |
|  |
| |
| |
| In the sidebar on the left, each step of execution of the fragment shader is |
| listed. You can click on each to move back and forth through the invocation. The |
| values of local variables will be updated as you do. |
| |
| Some of the usual things to look out for when debugging fragment shaders: |
| |
| * Pay attention to the input to the fragment stage from the vertex stage. This |
| is present in the argument marked with `[[stage_in]]`. |
| * The output of the stage (which defines the color of the texture element for |
| that invocation) is the return value of the invocation. |
| * If you aren’t sure of a particular operation within the shader, try adding |
| intermediate variables to the shader. The Impeller shader compiler will |
| faithfully add those intermediate for ease of debugging. Optimizations that |
| hinder debuggability are reserved for optimized release modes and occur on the |
| intermediate representation. |
| |
| |
| ### Debugging a Vertex Shader |
| |
| Since vertex shaders are run once per vertex in the draw call, it is easiest to |
| find an invocation of the vertex shader in the geometry viewer. |
| |
| In the `Bound Resources` of a specific draw call, open the `Geometry` section as |
| described in the section on [inspecting a single draw |
| call](#inspecting-a-single-draw-call). |
| |
| |
|  |
| |
| |
| In this view, the `Debug` button on the bottom right will be disabled unless a |
| specific vertex in the geometry has been selected. Once you select the vertex |
| whose vertex shader invocation you want to debug, the button should be enabled. |
| Click it. |
| |
|  |
| |
| |
| In the sidebar on the left, each step of execution of the vertex shader is |
| listed. You can click on each to move back and forth through the invocation. The |
| values of local variables will be updated as you do. |
| |
| Some of the usual things to look out for when debugging vertex shaders: |
| |
| * Pay attention to the input to the vertex stage invocation. This is present in |
| the argument marked with `[[stage_in]]`. This is the data you packed into the |
| vertex buffer for the draw call using an `impeller::VertexBufferBuilder`. |
| * The output of the stage (which defines vertex position in normalized device |
| coordinates) is the return value of the invocation. |
| * If you aren’t sure of a particular operation within the shader, try adding |
| intermediate variables to the shader. The Impeller shader compiler will |
| faithfully add those intermediate for ease of debugging. Optimizations that |
| hinder debuggability are reserved for optimized release modes and occur on the |
| intermediate representation. |
| |
| |
| ### Live Shader Editing & Debugging |
| |
| Often, it is useful to make minor edits to the shader to either visually see the |
| difference in the attachments or to see how local variables are affected. |
| |
| When debugging an instrumentation of either the vertex or fragment shader, you |
| have the ability to edit the Metal source code. When you do, the `Reload Shader` |
| button at the bottom of the shader viewer that is typically disabled becomes |
| enabled. |
| |
| |
|  |
| |
| |
| Click on that button to see what that invocation would look like had it used the |
| updated shader. In the example above, I added an additional offset of 150 units |
| to the vertex position supplied to the vertex shader by the vertex buffer. When |
| I clicked on the `Reload Shaders` button, the location of the triangles in both |
| the color and stencil attachments was updated. |
| |
| Unless you are only interested in inspecting local variables, it is often useful |
| to have the attachments viewer open side-by-side as you make live updates to the |
| shader. |
| |
| No changes are being made to your GLSL shaders in Impeller. This is purely a |
| debugging aid and you must re-create those changes in GLSL to commit to those |
| updates. |
| |
| # Finding Where API Calls Were Made in the Codebase |
| |
| From either the frame insights or by selecting an API call on the object, open |
| the call-stack to navigate to the code that made that call. Then add your label. |
| |
|  |
| |
| When inspecting an API call, reveal the call-stack. This resource has already |
| been labelled and you’ll find the call in `AllocatorMTL::CreateTexture`. |
| |
|  |
| |
| |
| This trace-first approach of navigating an unfamiliar codebase is unreasonably |
| effective. |
| |
| # Next Steps & Further Reading |
| |
| * Try repeating similar steps using a different profiler like RenderDoc or |
| Android GPU Inspector. |
| * [Watch] WWDC 2018: [Metal Shader Debugging & |
| Profiling](https://developer.apple.com/videos/play/wwdc2018/608/). |
| * [Watch] WWDC 2020: [Gain insights into your Metal app with |
| Xcode 12](https://developer.apple.com/videos/play/wwdc2020/10605). |
| * [Watch] WWDC 2020: [Optimize Metal apps and games with GPU |
| counters](https://developer.apple.com/videos/play/wwdc2020/10603). |