| # iOS CPU Profiling |
| |
| XCode (via Instruments) has a number of built in profiling tools that can easily be used with local or prebuilt engines. This document is focused on creating [Flame Graphs](https://www.brendangregg.com/flamegraphs.html). These are not part of XCode but provide a useful way to look at aggregate performance. The process for generating Flame Graphs for iOS/macOS is a bit janky compared to Android Studio however and external tools are necessary. |
| |
| ## Setup External Tools |
| |
| We need to setup the [`FlameGraph` Swift command-line tool](https://github.com/lennet/FlameGraph). You can either [build the tool locally](https://github.com/lennet/FlameGraph?tab=readme-ov-file#swift-package-manager), or use the [Mint Package Manager](https://github.com/yonaskolb/mint) for Swift packages. We'll use Mint in the following example. |
| |
| Skip the following steps if you have already performed them. |
| |
| ### Install Mint |
| |
| Install Mint via Brew. |
| |
| ```sh |
| brew install mint |
| ``` |
| |
| Add the Mint `bin` directory to your path. The following assumes your `.rc` file is `.profile`. Adjust as necessary. |
| |
| ```sh |
| echo 'export PATH="$PATH:$HOME/.mint/bin"' >> ~/.profile |
| source ~/.profile |
| ``` |
| |
| ### Install FlameGraph via Mint |
| |
| ```sh |
| mint install lennet/FlameGraph |
| ``` |
| |
| ## Capture Profile using Instruments |
| |
| Use the Time Profiler Xcode template. |
| |
| 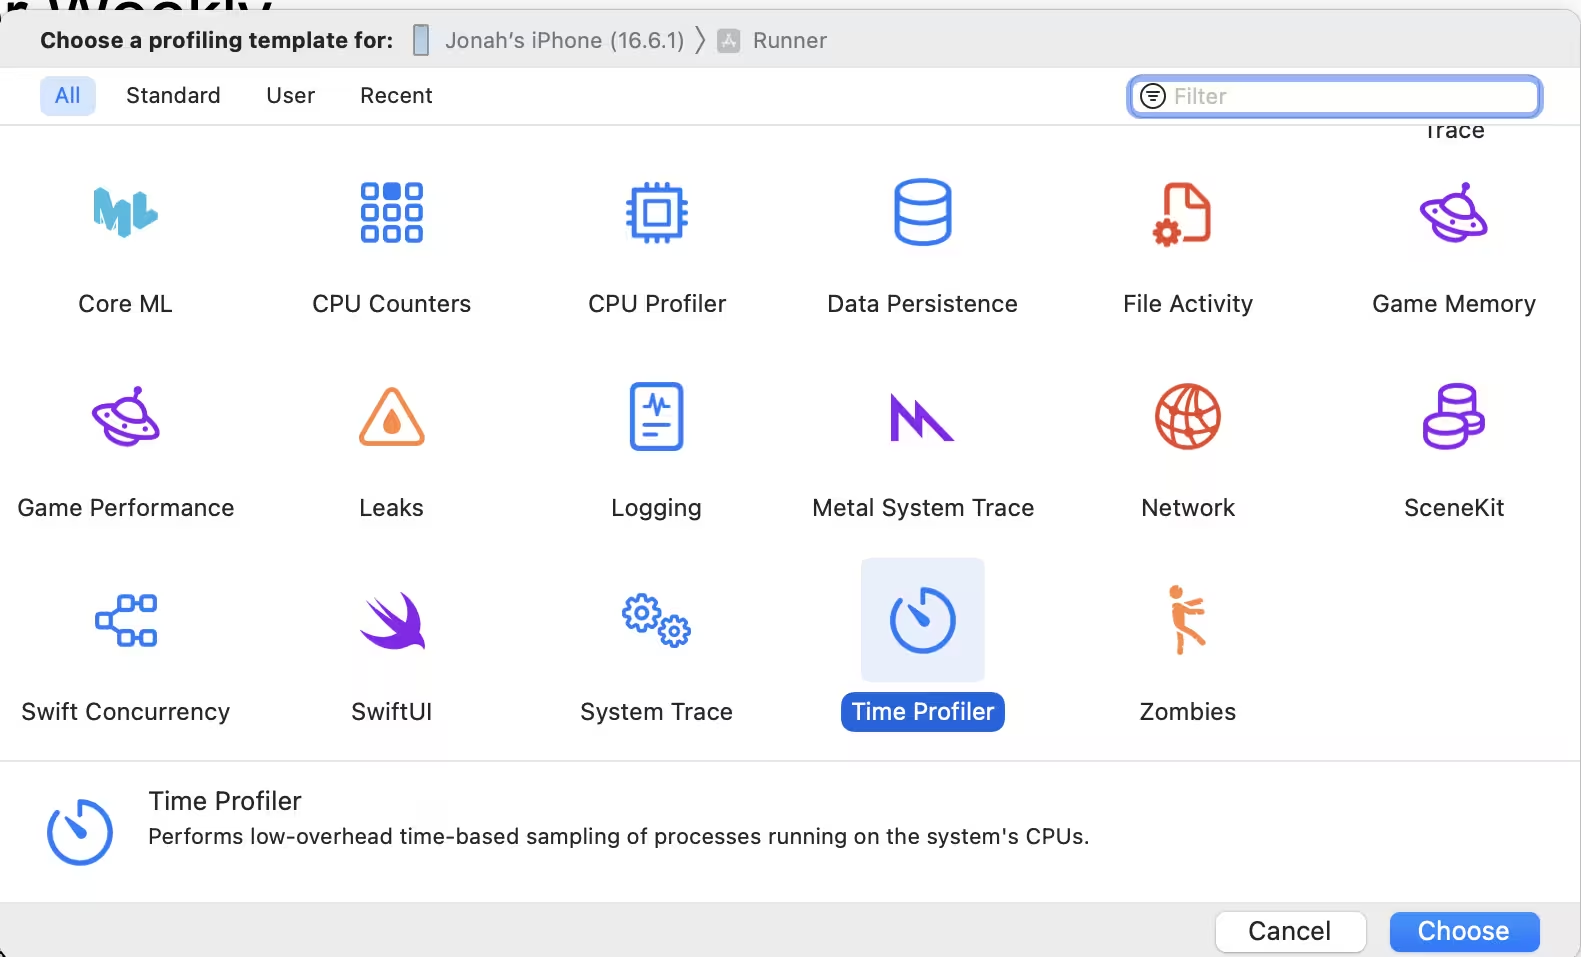 |
| |
| Click the red dot to begin and record as much profile data as you want. Press stop to conclude the trace. |
| |
| Select the thread to investigate, in this case you want `io.flutter.raster`. |
| |
| > [!IMPORTANT] |
| > Make sure to select the trace root. |
| |
| 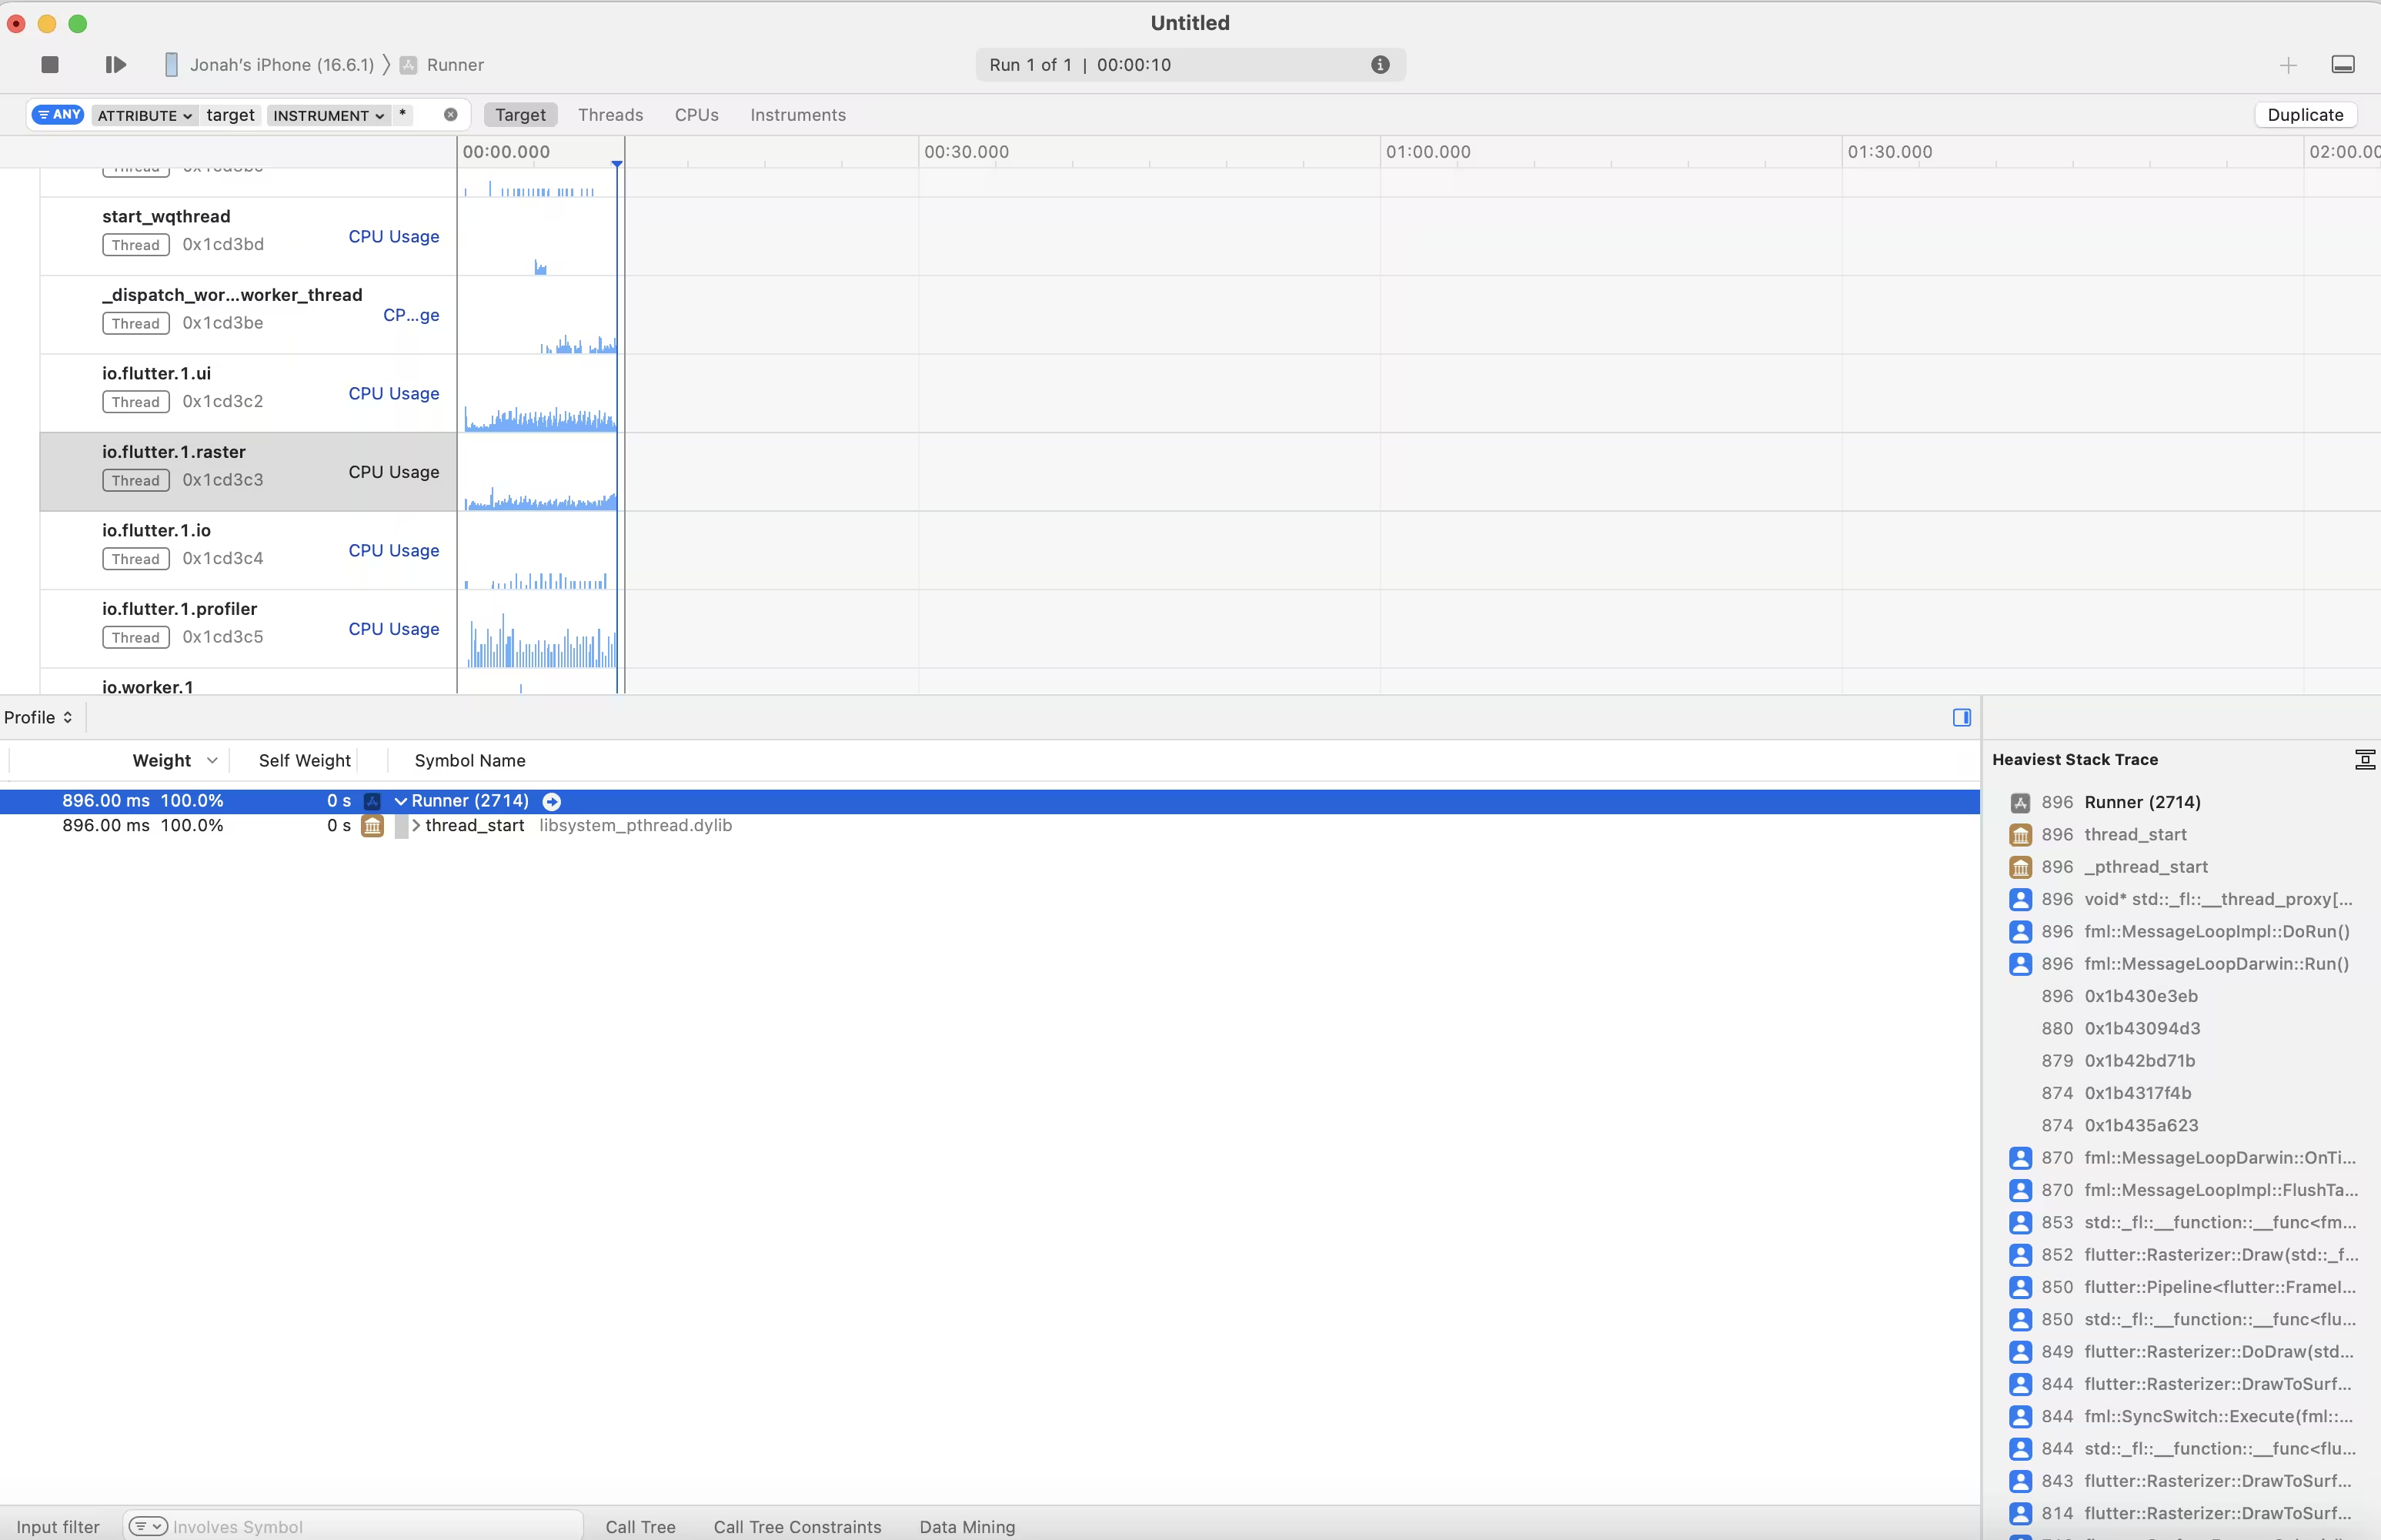 |
| |
| Copy the trace with the keyboard shortcut (⇧⌘C) or the menu ("Edit" -> "Deep Copy"). |
| |
| 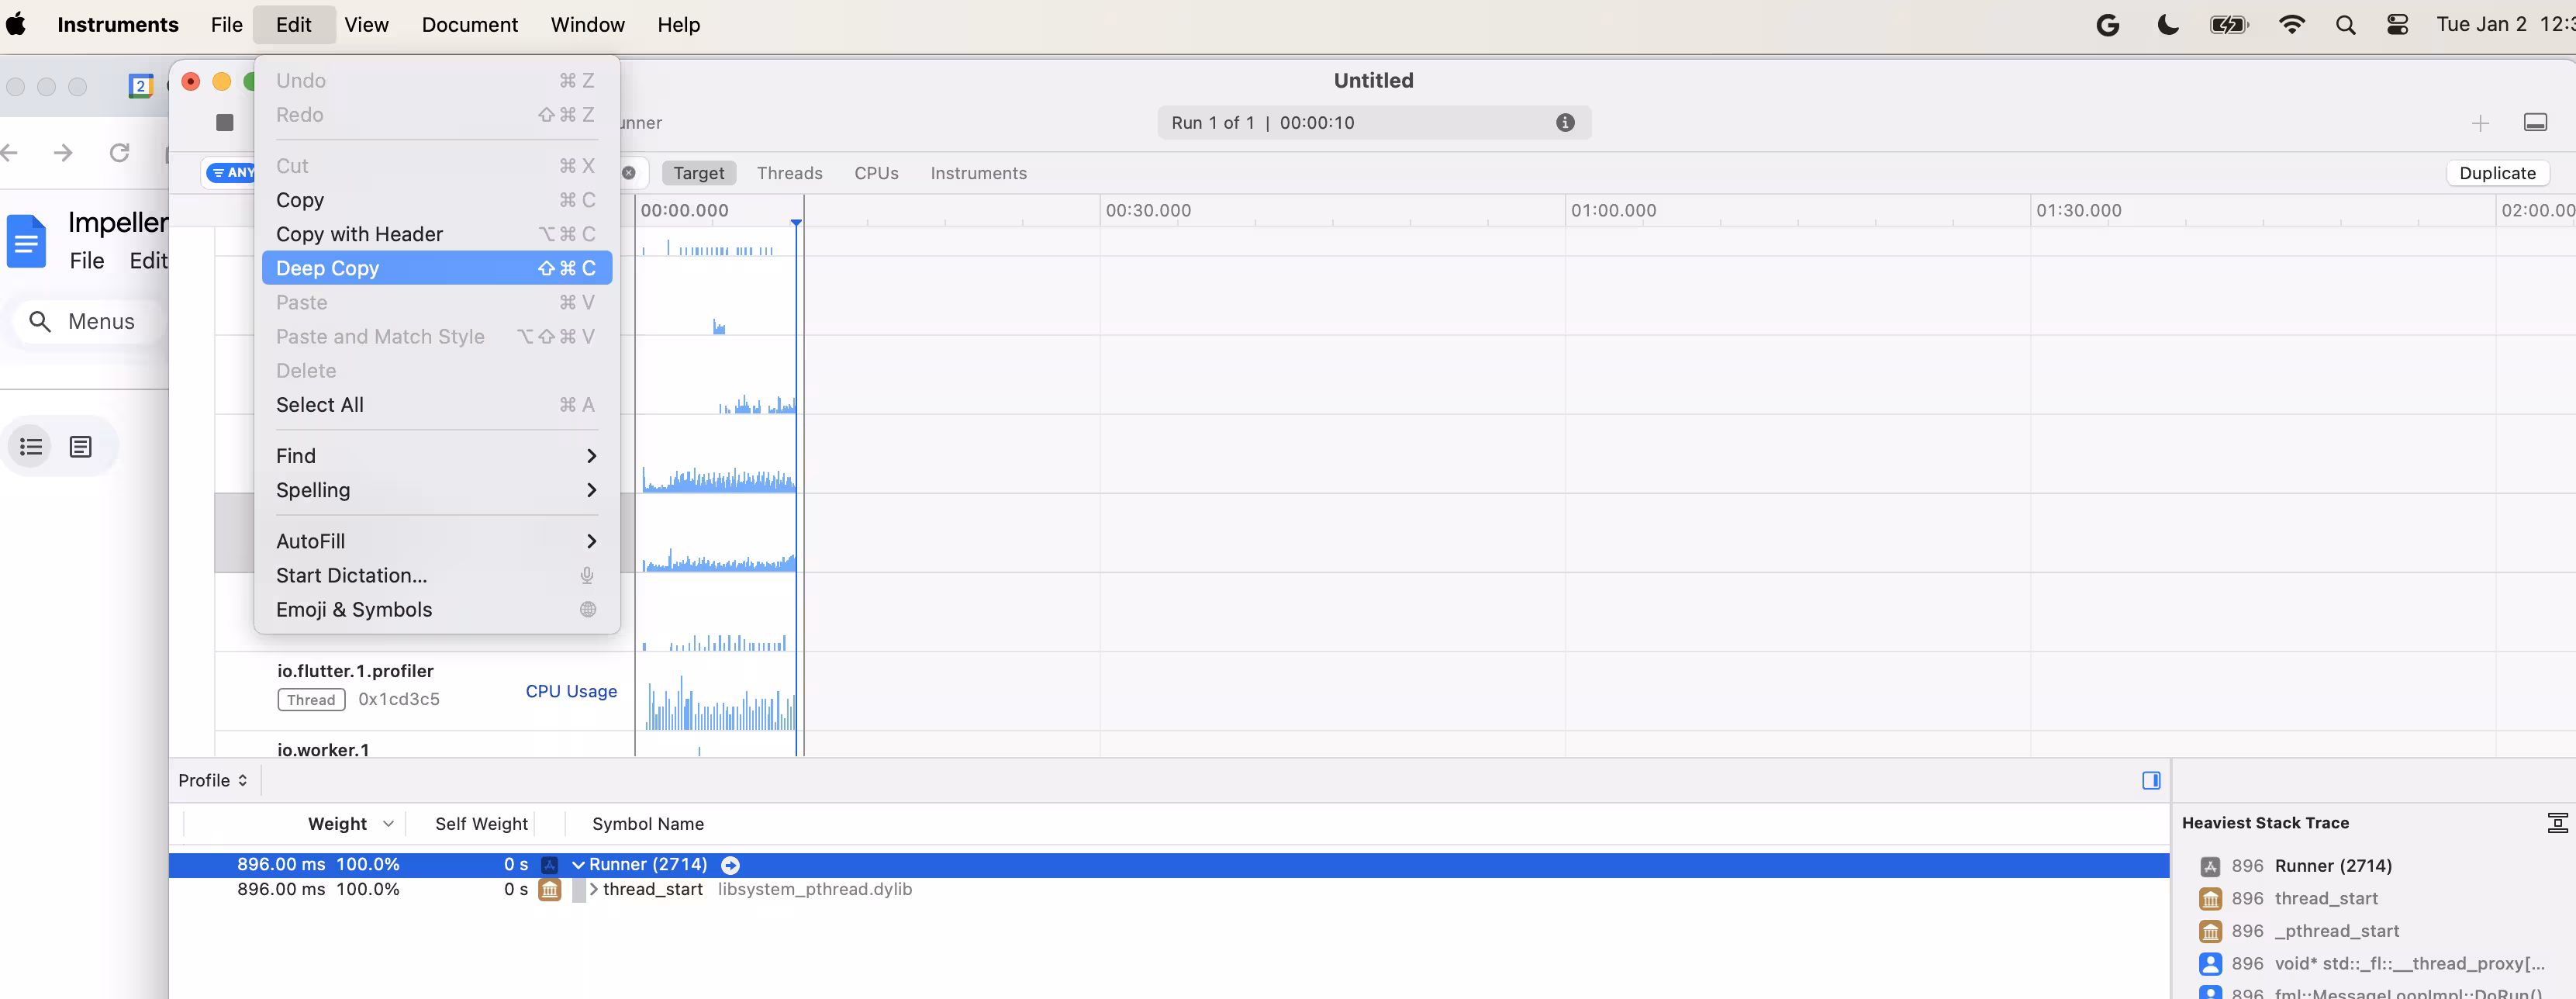 |
| |
| ## Convert Profile to FlameGraph |
| |
| On the command line, run `FlameGraph` to convert the contents of the profile in your pasteboard to an HTML format. |
| |
| ```sh |
| FlameGraph --html output.html |
| ``` |
| |
| A new browser tab will open with the Flame Graph. It may require some zooming to be useful. |
| |
|  |