docs: Merge back from sprint repo

Merge the result of the docs sprint back into
master.

Change-Id: I30161f4bfc30a14b2d55dae1bc13f5396217d6b7
diff --git a/README.md b/README.md
index be4c683..a1a3a74 100644
--- a/README.md
+++ b/README.md
@@ -1,28 +1,9 @@
-# Perfetto - Performance instrumentation and tracing
+# Perfetto - System profiling, app tracing and trace analysis

-Perfetto is an open-source project for performance instrumentation and tracing
-of Linux/Android/Chrome platforms and user-space apps.
+Perfetto is a production-grade open-source stack for performance
+instrumentation and trace analysis. It offers services and libraries and for
+recording system-level and app-level traces, native + java heap profiling, a
+library for analyzing traces using SQL and a web-based UI to visualize and
+explore multi-GB traces.

-See [www.perfetto.dev](https://www.perfetto.dev) for docs.
-
-Contributing
-------------
-See [/docs/contributing.md](docs/contributing.md) for instructions.
-
-The source-of-truth repo is [Android's Gerrit][aosp].
-The [GitHub repo](https://github.com/google/perfetto) is a read-only mirror.
-
-Bugs
-----
-* For bugs affecting Android or the tracing internals use the internal
-bug tracker ([go/perfetto-bugs](http://goto.google.com/perfetto-bugs)).
-* For bugs affecting Chrome use http://crbug.com, Component:Speed>Tracing
-label:Perfetto.
-
-Community
----------
-You can reach us on our [Discord channel](https://discord.gg/35ShE3A).
-If you prefer using IRC we have an experimental Discord <> IRC bridge
-synced with `#perfetto-dev` on [Freenode](https://webchat.freenode.net/).
-
-[aosp]: https://android.googlesource.com/platform/external/perfetto/
+See https://docs.perfetto.dev or the /docs/ directory for documentation.
diff --git a/docs/README.md b/docs/README.md
index 59de543..00a5e9a 100644
--- a/docs/README.md
+++ b/docs/README.md
@@ -1,104 +1,167 @@
-# Perfetto - Performance instrumentation and tracing
+# Perfetto - System profiling, app tracing and trace analysis
-Perfetto is an open-source project for performance instrumentation and tracing
-of Linux/Android/Chrome platforms and user-space apps.
-It consists of:
+Perfetto is a production-grade open-source stack for performance
+instrumentation and trace analysis. It offers services and libraries and for
+recording system-level and app-level traces, native + java heap profiling, a
+library for analyzing traces using SQL and a web-based UI to visualize and
+explore multi-GB traces.
-**A portable, high efficiency, user-space tracing library**
-designed for tracing of multi-process systems, based on zero-alloc zero-copy
-zero-syscall (on fast-paths) writing of protobufs over shared memory.
+
-**OS-wide Linux/Android probes for platform debugging**
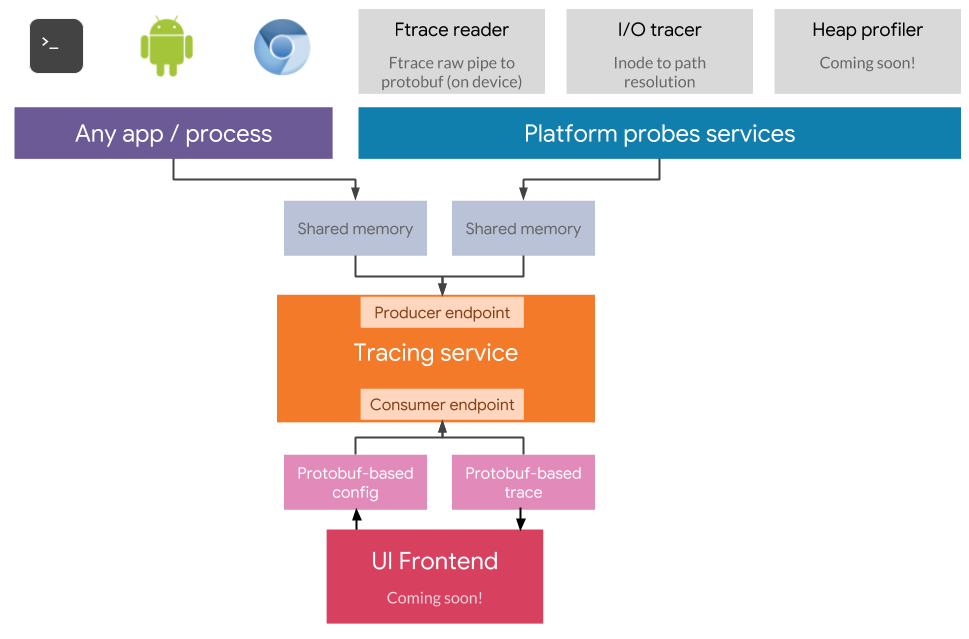
-* Kernel tracing: a daemon that converts Kernel [Ftrace][ftrace] events into
- API-stable protobufs, on device, with low overhead.
-* [Heap profiling](heapprofd): low-overhead, out of process unwinding,
- variable sample rate, attachable to already running processes.
-* Power rails sampling
-* System stat counters
-* Chrome userspace tracing
-* I/O tracing
-* Many new probes coming soon: heap profiling, perf sampling, syscall tracing.
+## Recording traces
-**Processing of traces**
-[A C++ library for efficient processing and extraction of trace-based
-metrics.](trace-processor). The library accepts both protobuf and json-based
-traces as input and exposes an SQL query interface to the data.
-The library is built to be linked by other programs but can also be used
-standalone as a command line tool.
+At its core, Perfetto introduces a novel userspace-to-userspace
+[tracing protocol](/docs/design-docs/api-and-abi.md#tracing-protocol-abi) based
+on direct protobuf serization onto a shared memory buffer. The tracing protocol
+is used both internally for the built-in data sources and exposed to C++ apps
+through the [Tracing SDK](/docs/instrumentation/tracing-sdk.md) and the
+[Track Event Library](/docs/instrumentation/track-events.md).
+This new tracing protocol allows dynamic configuration of all aspects of tracing
+through an extensible protobuf-based capability advertisement and data source
+configuration mechanism (see
+[Trace configuration docs](/docs/concepts/config.md)).
+Different data sources can be multiplexed onto different sub-sets of
+user-defined buffers, allowing also streaming of
+[arbitrarily long traces](/docs/concepts/config.md#long-traces) into the
+filesystem.
-**Web-based frontend**
-An open-source UI for inspection and analysis of traces.
-Available at [ui.perfetto.dev](https://ui.perfetto.dev).
-The UI is built on top of C++ trace processor library which is cross-compiled
-to WASM to run locally in the browser.
+### System-wide tracing on Android and Linux
+On Linux and Anroid, Perfetto bundles a number of data sources that are able to
+gather detailed performance data from different system interfaces. For the full
+sets and details see the _Data Sources_ section of the documentation. Same
+examples:
-
+* [Kernel tracing](/docs/data-sources/cpu-scheduling.md): Perfetto integrates
+ with [Linux's ftrace][ftrace] and allows to record kernel events (e.g
+ scheduling events, syscalls) into the trace.
-Goals
------
-Perfetto is building the next-gen unified tracing ecosystem for:
-- Android platform tracing ([Systrace][systrace])
-- Chrome platform tracing ([chrome://tracing][chrome-tracing])
-- App-defined user-space tracing (including support for non-Android apps).
+* [/proc and /sys pollers](/docs/data-sources/memory-counters.md), which allow
+ to sample the state of process-wide or system-wide cpu and memory counters
+ over time.
-The goal is to create an open, portable and developer friendly tracing ecosystem
-for app and platform performance debugging.
+* Integration with Android HALs modules for recording [battery and energy-usage
+ counters](/docs/data-sources/battery-counters.md).
-Key features
-------------
-**Designed for production**
-Perfetto's tracing library and daemons are designed for use in production.
-Privilege isolation is a key design goal:
-* The interface for writing trace events are decoupled from the interface for
- read-back and control and can be subjected to different ACLs.
-* Despite being based on shared memory, Perfetto is designed to prevent
- cross-talk between data sources, even in case of arbitrary code execution
- (memory is shared point-to-point, memory is never shared between processes).
-* Perfetto daemons are designed following to the principle of least privilege,
- in order to allow strong sandboxing (via SELinux on Android).
+* [Native heap profiling](/docs/data-sources/native-heap-profiler.md): a
+ low-overhead heap profiler for hooking malloc/free/new/delete and associating
+ memory to callstacks, based on out-of-process unwinding, configurable
+ sampling, attachable to already running processes.
-See [security-model.md](security-model.md) for more details.
+* [Java heap profiling](/docs/data-sources/java-heap-profiler.md): an
+ out-of-process profiler tightly integrated with the Android RunTime that
+ allows to get full snapshots of the managed heap retention graph (types,
+ field names, retained size and references to other objects) without, however,
+ dumping the full heap contents (strings and bitmaps) and hence reducing the
+ serialization time and output file size.
-**Long traces**
-Pefetto aims at supporting hours-long / O(100GB) traces, both in terms of
-recording backend and UI frontend.
+On Android, Perfetto is the next-generation system tracing system and replaces
+the chromium-based systrace.
+[ATrace-based intstrumentation](/docs/data-sources/atrace.md) remains fully
+supported.
+See [Android developer docs](https://developer.android.com/topic/performance/tracing)
+for more details.
-**Interoperability**
-Perfetto traces (output) and configuration (input) consists of protobuf
-messages, in order to allow interoperability with several languages.
+### Tracing SDK and user-space instrumentation
-See [trace-format.md](trace-format.md) for more details.
+The [Perfetto Tracing SDK](/docs/instrumentation/tracing-sdk.md) enables C++
+developers to enrich traces with app-specific trace points. You can choose
+between the flexibility of defining your own strongly-typed events and creating
+custom data sources or using the easier-to-use
+[Track Event Library](/docs/instrumentation/track-events.md) which allows to
+easily create time-boudned slices, counters and time markers using annotations
+of the form `TRACE_EVENT("category", "event_name", "x", "str", "y", 42)`.
-**Composability**
-As Perfetto is designed both for OS-level tracing and app-level tracing, its
-design allows to compose several instances of the Perfetto tracing library,
-allowing to nest multiple layers of tracing and drive then with the same
-frontend. This allows powerful blending of app-specific and OS-wide trace
-events.
-See [multi-layer-tracing.md](multi-layer-tracing.md) for more details.
+The SDK is designed for tracing of multi-process systems and multi-threaded
+processes. It is based on [ProtoZero](/docs/design-docs/protozero.md), a library
+for direct writing of protobuf events on thread-local shared memory buffers.
-**Portability**
-The only dependencies of Perfetto's tracing libraries are C++11 and [Protobuf lite][protobuf] (plus google-test, google-benchmark, libprotobuf-full for testing).
+The same code can work both in fully-in-process mode, hosting an instance of the
+Perfetto tracing service on a dedicated thread, or in _system mode_, connecting
+to the Linux/Android tracing daemon through a UNIX socket, allowing to combine
+app-specific instrumentation points with system-wide tracing events.
-**Extensibility**
-Perfetto allows third parties to defined their own protobufs for:
-* [(input) Configuration](/protos/perfetto/config/data_source_config.proto#52)
-* [(output) Trace packets](/protos/perfetto/trace/trace_packet.proto#36)
+The SDK is based on portable C++11 code [tested](/docs/contributing/testing.md)
+with the major C++ sanitizers (ASan, TSan, MSan, LSan). It doesn't rely on
+run-time code modifications or compiler plugins.
-Allowing apps to define their own strongly-typed input and output schema.
-See [trace-format.md](trace-format.md) for more details.
+### Tracing in Chromium
-Bugs
-----
-* For bugs affecting Android or the tracing internals use the internal
-bug tracker ([go/perfetto-bugs](http://goto.google.com/perfetto-bugs)).
-* For bugs affecting Chrome use http://crbug.com, Component:Speed>Tracing
-label:Perfetto.
+Perfetto has been designed from the grounds to replace the internals of the
+[chrome://tracing infrastructure][chrome-tracing]. Tracing in Chromium and its
+internals are based on Perfetto's codebase on all major platforms (Android,
+CrOS, Linux, MacOS, Windows).
+The same [service-based architecture](/docs/concepts/service-model.md) of
+system-wide tracing applies, but internally the Chromium Mojo IPC system is
+used instead of Perfetto's own UNIX socket.
+By default tracing works in in-process mode in Chromium, recording only data
+emitted by Chromium processes. On Android (and on Linux, if disabling the
+Chromium sandbox) tracing can work in hybrid in-process+system mode, combining
+chrome-specific trace events with Perfetto system events.
+
+_(Googlers: see [go/chrometto](https://goto.google.com/chrometto) for more)_
+
+## Trace analysis
+
+Beyond the trace recording capabilities, the Perfetto codebase includes a
+dedicated project for importing, parsing and querying new and legacy trace
+formats, [Trace Processor](/docs/analysis/trace-processor.md).
+
+Trace Processor is a portable C++11 library that provides a column-oriented
+table storage, designed ad-hoc for for efficiently holding hours of trace data
+into memory and exposes a SQL query interface based on the popular SQLite query
+engine.
+The trace data model becomes a set of
+[SQL tables](/docs/analysis/sql-tables.autogen) which can be queried and joined
+in extremely powerful and flexible ways to analyze the trace data.
+
+On top of this, Trace Processor includes also a
+[trace-based metrics subsystem](/docs/analysis/metrics.md) consisting of
+pre-baked and extensible queries that can output strongly-typed summaries
+about a trace in the form of JSON or protobuf messages (e.g., the CPU usage
+at different frequency states, breakdown by process and thread).
+
+Trace-based metrics allow an easy integration of traces in performance testing
+scenarios or batch analysis or large corpuses of traces.
+
+Trace Processor is also designed for low-latency queries and for building
+trace visualizers. Today Trace Processor is used by the
+[Perfetto UI](https://ui.perfetto.dev) as a Web Assembly module,
+[Android Studio](https://developer.android.com/studio) and
+[Android GPU Inspector](https://gpuinspector.dev/) as native C++ library.
+
+## Trace visualization
+
+Perfetto provides also a brand new trace visualizer for opening and querying
+hours-long traces, available at [ui.perfetto.dev](https://ui.perfetto.dev).
+The new visualizer takes advantage of modern web platform technolgies.
+Its multi-threading design based WebWorkers keeps the UI always responsive;
+the analytical power of Trace Processor and SQLite is fully available in-browser
+through WebAssembly.
+
+The Perfetto UI works fully offline after it has been opened once. Traces opened
+with the UI are processed locally by the browser and do not require any
+server-side interaction.
+
+
+
+## Contributing
+
+See the [Contributing -> Getting started page](/docs/contributing/getting-started.md).
+
+## Bugs
+
+For bugs affecting Android or the tracing internals:
+
+* **Googlers**: use the internal bug tracker [go/perfetto-bugs](http://goto.google.com/perfetto-bugs)
+
+* **Non-Googlers**: use [GitHub issues](https://github.com/google/perfetto/issues).
+
+For bugs affecting Chrome Tracing:
+
+* Use http://crbug.com `Component:Speed>Tracing label:Perfetto`.
[ftrace]: https://www.kernel.org/doc/Documentation/trace/ftrace.txt
-[systrace]: https://developer.android.com/studio/command-line/systrace.html
[chrome-tracing]: https://www.chromium.org/developers/how-tos/trace-event-profiling-tool
-[protobuf]: https://developers.google.com/protocol-buffers/
diff --git a/docs/analysis.md b/docs/analysis.md
deleted file mode 100644
index 406fc99..0000000
--- a/docs/analysis.md
+++ /dev/null
@@ -1,194 +0,0 @@
-# Trace analysis
-
-Trace analysis refers to a set of features built into the Perfetto
-[trace processor](trace-processor.md) and Perfetto UI which enrich a trace with
-extra information synthesized during the import of a trace. There are three
-features which currently part of this project:
-
-- [Adding descriptions of slices](#descriptions)
-- [Annotating the trace with new events](#annotations)
-- [Alerts](#alerts)
-
-## <a name="descriptions"></a>Adding descriptions to slices
-
-
-**<p align="center">Description for the measure slice</p>**
-
-### Background
-
-Descriptions attach a human-readable description to a slice in the trace. This
-can include information like the source of a slice, why a slice is important and
-links to documentation where the viewer can learn more about the slice. In
-essence, descriptions act as if an expert was telling the user what the slice
-means.
-
-For example, consider the `inflate` slice which occurs during view inflation in
-Android. We can add the following description and link:
-
-```
-Description: Constructing a View hierarchy from pre-processed XML via LayoutInflater#layout. This includes constructing all of the View objects in the hierarchy, and applying styled attributes.
-
-Link: https://developer.android.com/reference/android/view/layoutinflater#inflate(int,%20android.view.viewgroup)
-```
-
-### Adding descriptions to a slice
-
-Adding a new event just requires a self-contained change to the
-[`DescribeSlice`](../src/trace_processor/analysis/describe_slice.h) function.
-The inputs are the table containing all the slices from the trace and the id of
-the slice which an embedder (e.g. the UI) is requesting a description for. The
-output is a `SliceDescription` which is simply a `pair<description, doc link>`.
-
-Currently, all implemented descriptions are based on only the name of the slice
-itself. However, it is straightforward to extend this to also consider the
-ancestor slices and other similar properties of the slice and we plan on doing
-this in the future.
-
-### Using descriptions as a trace processor embedder
-
-The `DescribeSlice` function is exposed to SQL through the `describe_slice`
-table. This table has the following schema:
-
-| Name | Type | Meaning |
-| :---------- | ------ | ---------------------------------------------------------------------------- |
-| description | string | Provides the description for the given slice |
-| doc_link | string | Provides a hyperlink to documentation which gives more context for the slice |
-
-The table also has a hidden column `slice_id` which need to be set equal to the
-id of the slice that you want to obtain the description from. For example, to
-get the description and doc link for slice with id `5`:
-
-```sqlite
-select description, doc_link
-from describe_slice
-where slice_id = 5
-```
-
-You can also _join_ the `describe_slice` table with the slice table to obtain
-descriptions for more than one slice. For example, to get the ts, duration and
-description for all `measure` slices:
-
-```sqlite
-select ts, dur, description
-from slice s
-join desribe_slice d on s.id = d.slice_id
-where name = 'measure'
-```
-
-## <a name="annotations"></a>Annotating the trace with new events
-
-
-**<p align="center">Annotation slice track containing app startups</p>**
-
-
-**<p align="center">Annotation counter track added to measure ION
-allocations</p>**
-
-### Background
-
-The annotations feature allows creation of new events (slices and counters) from
-the data in the trace. These events can then be displayed in the UI tracks as if
-they were part of the trace itself.
-
-This feature is useful as often the data in the trace is very low-level. While
-this low level information is important to expose for experts to perform deep
-debugging, often the user is looking to get a high level overview without
-needing to piece together events from multiple places in the trace.
-
-For example, an app startup in Android spans multiple components including
-`ActivityManager`, `system_server` and the newly created app process derived
-from `zygote`. Most users do not need startup broken down to this level of
-detail; instead they are simply interested in a single slice spanning the whole
-startup duration.
-
-The annotations feature is tied very closely to [metrics subsystem](metrics.md);
-Often the SQL-based metrics often need to create higher-level abstractions from
-raw slices as intermediate artifacts. From previous example, the
-[startup metric](../src/trace_processor/metrics/android/android_startup.sql), it
-creates the exact `launching` slice we want to display in the UI.
-
-The other benefit of aligning the two is that changes in metrics are
-automatically kept in sync with what the user sees in the UI.
-
-### Adding annotations to a new or existing metric
-
-As annotations depend on metrics, the initial steps are same as that of
-[developing a metric](metrics.md). In summary:
-
-- Create a new proto message for your metric and add it to the
- [`TraceMetrics`](../protos/perfetto/metrics/metrics.proto) proto
-- Write a new SQL metric file in the [metrics](../src/trace_processor/metrics)
- folder. Good examples to follow are
- [ion](../src/trace_processor/metrics/android/android_ion.sql) and
- [startup](../src/trace_processor/metrics/android/android_startup.sql) metrics
-
-**Note**: the metric can be just an empty proto message during prototyping or if
-you think that no summarisation is necessary. However, generally if an event is
-important enough to display in the UI, it should also be tracked in benchmarks
-as a metric.
-
-To extend a metric with annotations, a new table or view with the name
-`<metric name>_annotations` needs to be created (the trailing `_annotations`
-suffix in the table name is important). For example, for the
-[`android_startup`]() metric, we create a view named
-`android_startup_annotations`.
-
-The schema of this table/view is as follows:
-
-| Name | Type | Presence | Meaning |
-| :----------- | -------- | ------------------------------------- | --------------------------------------------- |
-| `track_type` | `string` | Mandatory | 'slice' for slices, 'counter' for counters |
-| `track_name` | `string` | Mandatory | Name of the track to display in the UI |
-| `ts` | `int64` | Mandatory | The timestamp of the event (slice or counter) |
-| `dur` | `int64` | Mandatory for slice, NULL for counter | The duration of the slice |
-| `slice_name` | `string` | Mandatory for slice, NULL for counter | The name of the slice |
-| `value` | `double` | Mandatory for counter, NULL for slice | The value of the counter |
-
-**Note:** `track_name` acts as the track identifier i.e. all events with the
-same `track_name` are placed onto the same track.
-
-Currently, there are a few limitations to what can be displayed with
-annotations:
-
-- Nested slices within the same track are not supported. We plan to support this
- once we have a concrete usecase.
-- Tracks are always created in the global scope. We plan to extend this to
- threads and processes in the near future with additional contexts added as
- necessary.
-- Instant events are currently not supported in the UI but this will be
- implemented in the near future. In trace processor, instants are always `0`
- duration slices with special rendering on the UI side.
-- There is no way to tie newly added events back to the source events in the
- trace which were used to generate them. This is not currently a priority but
- something we may add in the future.
-
-### Using annotations as a trace processor embedder
-
-As annotations are tied to the metrics subsystem, the `ComputeMetrics` function
-in the trace processor API should be called with the appropriate metrics. This
-will create the `<metric_name>_annotations` table/view which can then be queried
-using the `ExectueQuery` function.
-
-**Note**: We plan at some point to have an API which does not create and return
-the full metrics proto but instead just executes the queries in the metric.
-
-## <a name="alerts"></a>Alerts
-
-### Background
-
-Alerts are used to draw the attention of the user to interesting parts of the
-trace; this are usually warnings or errors about anomalies which occured in the
-trace.
-
-### Current status
-
-Currently, alerts are not implemented in the trace processor but the annotations
-feature was designed with them in mind. We plan on adding another column
-`alert_type` (name to be finalized) to the annotations table which can have the
-value `warning`, `error` or `null`. Depending on this value, the Perfetto UI
-will flag these events to the user.
-
-**Note**: we do not plan on supporting case where alerts need to be added to
-existing events. Instead, new events should be created using annotations and
-alerts added on these instead; this is because the trace processor storage is
-append-only.
diff --git a/docs/analysis/metrics.md b/docs/analysis/metrics.md
new file mode 100644
index 0000000..7ab44d2
--- /dev/null
+++ b/docs/analysis/metrics.md
@@ -0,0 +1,369 @@
+# Trace-based metrics
+
+_The metrics subsystem is a part of the
+[trace processor](/docs/analysis/trace-processor.md) which uses traces to
+compute reproducible metrics. It can be used in a wide range of situations;
+examples include benchmarks, lab tests and on large corpuses of traces._
+
+
+
+## Quickstart
+
+The [quickstart](/docs/quickstart/trace-analysis.md) provides a quick overview
+on how to compute trace-based metrics traces using trace processor.
+
+## Introduction
+
+### Motivation
+
+Performance metrics are useful to monitor for the health of a system and ensure
+that a system does not regress over time as new features are added.
+
+However, metrics retrieved directly from the system have a downside: if there is
+a regression, it is difficult to root-cause the issue. Often, the problem may
+not be reproducible or may rely on a particular setup.
+
+Trace-based metrics are one possible solution to this problem. Instead of
+collecting metrics directly on the system, a trace is collected and metrics are
+computed from the trace. If a regression in the metric is spotted, the developer
+can look directly at the trace to understand why the regression has occurred
+instead of having to reproduce the issue.
+
+### Metric subsystem
+
+The metric subsystem is a part of the
+[trace processor](/docs/analysis/trace-processor.md) which executes SQL queries
+against traces and produces a metric which summarizes some performance attribute
+(e.g. CPU, memory, startup latency etc.).
+
+For example, generating the Android CPU metrics on a trace is as simple as:
+
+```python
+> ./trace_processor --run-metrics android_cpu <trace>
+android_cpu {
+ process_info {
+ name: "/system/bin/init"
+ threads {
+ name: "init"
+ core {
+ id: 1
+ metrics {
+ mcycles: 1
+ runtime_ns: 570365
+ min_freq_khz: 1900800
+ max_freq_khz: 1900800
+ avg_freq_khz: 1902017
+ }
+ }
+ ...
+ }
+ ...
+ }
+ ...
+}
+```
+
+### Case for upstreaming
+
+Authors are strongly encouraged to add all metrics derived on Perfetto traces to
+the Perfetto repo unless there is a clear usecase (e.g. confidentiality) why
+these metrics should not be publicly available.
+
+In return for upstreaming metrics, authors will have first class support for
+running metrics locally and the confidence that their metrics will remain stable
+as trace processor is developed.
+
+As well as scaling upwards while developing from running on a single trace
+locally to running on a large set of traces, the reverse is also very useful.
+When an anomaly is observed in the metrics of a lab benchmark, a representative
+trace can be downloaded and the same metric can be run locally in trace
+processor.
+
+Since the same code is running locally and remotely, developers can be confident
+in reproducing the issue and use the trace processor and/or the Perfetto UI to
+identify the problem.
+
+## Walkthrough: prototyping a metric
+
+TIP: To see how to add to add a new metric to trace processor, see the checklist
+[here](/docs/contributing/common-tasks.md#new-metric)
+
+This walkthrough will outline how to prototype a metric locally without needing
+to compile trace processor. This metric will compute the CPU time for every
+process in the trace and list the names of the top 5 processes (by CPU time) and
+the number of threads created by the process.
+
+NOTE: See this [GitHub gist][gist] to see how the code should look at the end of
+ the walkthrough. The prerequisites and Step 4 below give instructions on
+ how to get trace processor and run the metrics code.
+
+[gist]: https://gist.github.com/tilal6991/c221cf0cae17e298dfa82b118edf9080
+
+### Prerequisites
+
+As a setup step, create a folder to act as a scratch workspace; this folder will be referred to using the env variable `$WORKSPACE` in Step 4.
+
+The other requirement is trace processor. This can downloaded from [here](https://get.perfetto.dev/trace_processor) or can be built from source
+using the instructions [here](trace-processor.md). Whichever method is chosen, $TRACE_PROCESSOR env variable will be used to refer to the location of the binary in Step 4.
+
+### Step 1
+
+As all metrics in the metrics platform are defined using protos, the metric needs to be structured as a proto. For this metric, there needs to be some notion of a process name along with its CPU time and number of threads.
+
+Starting off, in a file named `top_five_processes.proto` in our workspace, create a basic proto message called ProcessInfo with those three fields:
+
+```protobuf
+message ProcessInfo {
+ optional string process_name = 1;
+ optional uint64 cpu_time_ms = 2;
+ optional uint32 num_threads = 3;
+}
+```
+
+Next , create a wrapping message which will hold the repeated field containing the top 5 processes.
+
+```protobuf
+message TopProcesses {
+ repeated ProcessInfo process_info = 1;
+}
+```
+
+Finally, define an extension to the root proto for all metrics (the [TraceMetrics](https://android.googlesource.com/platform/external/perfetto/+/HEAD/protos/perfetto/metrics/metrics.proto#39) proto).
+
+```protobuf
+extend TraceMetrics {
+ optional TopProcesses top_processes = 450;
+}
+```
+
+Adding this extension field allows trace processor to link the newly defined
+metric to the `TraceMetrics` proto.
+
+_Notes:_
+
+- The field ids 450-500 are reserved for local development so any of them can be used as the field id for the extension field.
+- The choice of field name here is important as the SQL file and the final table generated in SQL will be based on this name.
+
+Putting everything together, along with some boilerplate preamble gives:
+
+```protobuf
+syntax = "proto2";
+
+package perfetto.protos;
+
+import "protos/perfetto/metrics/metrics.proto";
+
+message ProcessInfo {
+ optional string process_name = 1;
+ optional int64 cpu_time_ms = 2;
+ optional uint32 num_threads = 3;
+}
+
+message TopProcesses {
+ repeated ProcessInfo process_info = 1;
+}
+
+extend TraceMetrics {
+ optional TopProcesses top_processes = 450;
+}
+```
+
+### Step 2
+
+Next, write the SQL to generate the table of the top 5 processes ordered by the
+sum of the CPU time they ran for and the number of threads which were associated
+with the process.
+
+The following SQL should added to a file called `top_five_processes.sql` in the
+workspace:
+
+```sql
+CREATE VIEW top_five_processes_by_cpu
+SELECT
+ process.name as process_name,
+ CAST(SUM(sched.dur) / 1e6 as INT64) as cpu_time_ms,
+ COUNT(DISTINCT utid) as num_threads
+FROM sched
+INNER JOIN thread USING(utid)
+INNER JOIN process USING(upid)
+GROUP BY process.name
+ORDER BY cpu_time_ms DESC
+LIMIT 5;
+```
+
+Let's break this query down:
+
+1. The first table used is the `sched` table. This contains all the scheduling
+ data available in the trace. Each scheduling "slice" is associated with a
+ thread which is uniquely identified in Perfetto traces using its `utid`. The
+ two pieces of information needed from the sched table are the `dur` -
+ short for duration, this is the amount of time the slice lasted - and the
+ `utid` which will be used to join with the thread table.
+2. The next table is the thread table. This gives us a lot of information which
+ is not particularly interesting (including its thread name) but it does give
+ us the `upid`. Similar to `utid`, `upid` is the unique identifier for a
+ process in a Perfetto trace. In this case, `upid` will refer to the process
+ which hosts the thread given by `utid`.
+3. The final table is the process table. This gives the name of the process
+ associated with the original sched slice.
+4. With the process, thread and duration for each sched slice, all the slices
+ for a single processes are collected and their durations summed to get the
+ CPU time (dividing by 1e6 as sched's duration is in nanoseconds) and
+ the number of distinct threads.
+5. Finally, we order by the cpu time and limit to the top 5 results.
+
+### Step 3
+
+Now that the result of the metric has been expressed as an SQL table, it needs
+to be converted to a proto. The metrics platform has built-in support for emitting
+protos using SQL functions; something which is used extensively in this step.
+
+Let's look at how it works for our table above.
+
+```sql
+CREATE VIEW top_processes_output AS
+SELECT TopProcesses(
+ 'process_info', (
+ SELECT RepeatedField(
+ ProcessInfo(
+ 'process_name', process_name,
+ 'cpu_time_ms', cpu_time_ms,
+ 'num_threads', num_threads
+ )
+ )
+ FROM top_five_processes_by_cpu
+ )
+);
+```
+
+Breaking this down again:
+
+1. Starting from the inner-most SELECT statement, there is what looks like
+ a function call to the ProcessInfo function; in fact this is no coincidence.
+ For each proto that the metrics platform knows about, an SQL function is
+ generated with the same name as the proto. This function takes key value
+ pairs with the key as the name of the proto field to fill and the value being
+ the data to store in the field. The output is the proto created by writing
+ the fields described in the function. (\*)
+
+ In this case, this function is called once for each row in the
+ `top_five_processes_by_cpu` table. The output will be the fully filled
+ ProcessInfo proto.
+
+ The call to the `RepeatedField` function is the most interesting part and
+ also the most important. In technical terms, `RepeatedField` is an aggregate
+ function. Practically, this means that it takes a full table of values and
+ generates a single array which contains all the values passed to it.
+
+ Therefore, the output of this whole SELECT statement is an array of 5
+ ProcessInfo protos.
+
+2. Next is creation of the `TopProcesses` proto. By now, the syntax should
+ already feel somewhat familiar; the proto builder function is called to fill
+ in the `process_info` field with the array of protos from the inner function.
+
+ The output of this SELECT is a single `TopProcesses` proto containing the
+ ProcessInfos as a repeated field.
+
+3. Finally, the view is created. This view is specially named to allow the
+ metrics platform to query it to obtain the root proto for each metric
+ (in this case `TopProcesses`). See the note below as to the pattern behind
+ this view's name.
+
+(\*) _This is not strictly true. To type-check the protos, some metadata
+is returned about the type of the proto but this is unimportant for metric
+authors._
+
+NOTE: It is important that the views be named {name of TraceMetrics extension
+ field}\_output. This is the pattern used and expected by the metrics
+ platform for all metrics.
+
+The final file should look like so:
+
+```sql
+CREATE VIEW top_five_processes_by_cpu AS
+SELECT
+ process.name as process_name,
+ CAST(SUM(sched.dur) / 1e6 as INT64) as cpu_time_ms,
+ COUNT(DISTINCT utid) as num_threads
+FROM sched
+INNER JOIN thread USING(utid)
+INNER JOIN process USING(upid)
+GROUP BY process.name
+ORDER BY cpu_time_ms DESC
+LIMIT 5;
+
+CREATE top_processes_output AS
+SELECT TopProcesses(
+ 'process_info', (
+ SELECT RepeatedField(
+ ProcessInfo(
+ 'process_name', process_name,
+ 'cpu_time_ms', cpu_time_ms,
+ 'num_threads', num_threads
+ )
+ )
+ FROM top_five_processes_by_cpu
+ )
+);
+```
+
+NOTE: The name of the SQL file should be the same as the name of TraceMetrics
+ extension field. This is to allow the metrics platform to associated the
+ proto extension field with the SQL which needs to be run to generate it.
+
+### Step 4
+
+For this step, invoke trace processor shell to run the metrics (see the
+[Quickstart](/docs/quickstart/trace-analysis.md) for downloading instructions):
+
+```shell
+$TRACE_PROCESSOR --run-metrics $WORKSPACE/top_five_processes.sql $TRACE 2> /dev/null
+```
+
+(For an example trace to test this on, see the Notes section below.)
+
+By passing the SQL file for the metric to be computed, trace processor uses the name of this file to find the proto and to figure out the name of the output table for the proto and the name of the extension field for `TraceMetrics`; this is the reason it was important to choose the names of these other objects carefully.
+
+_Notes:_
+
+- If something doesn't work as intended, check that the workspace looks the same as the contents of this [GitHub gist](https://gist.github.com/tilal6991/c221cf0cae17e298dfa82b118edf9080).
+- A good example trace for this metric is the Android example trace used by the Perfetto UI found [here](https://storage.googleapis.com/perfetto-misc/example_android_trace_30s_1).
+- stderr is redirected to remove any noise from parsing the trace that trace processor generates.
+
+If everything went successfully, the following output should be visible (specifically this is the output for the Android example trace linked above):
+
+```
+[perfetto.protos.top_five_processes] {
+ process_info {
+ process_name: "com.google.android.GoogleCamera"
+ cpu_time_ms: 15154
+ num_threads: 125
+ }
+ process_info {
+ process_name: "sugov:4"
+ cpu_time_ms: 6846
+ num_threads: 1
+ }
+ process_info {
+ process_name: "system_server"
+ cpu_time_ms: 6809
+ num_threads: 66
+ }
+ process_info {
+ process_name: "cds_ol_rx_threa"
+ cpu_time_ms: 6684
+ num_threads: 1
+ }
+ process_info {
+ process_name: "com.android.chrome"
+ cpu_time_ms: 5125
+ num_threads: 49
+ }
+}
+```
+
+### Next steps
+
+* The [common tasks](/docs/contributing/common-tasks.md) page gives a list of
+ steps on how new metrics can be added to the trace processor.
diff --git a/docs/analysis/trace-processor.md b/docs/analysis/trace-processor.md
new file mode 100644
index 0000000..236d871
--- /dev/null
+++ b/docs/analysis/trace-processor.md
@@ -0,0 +1,347 @@
+# Trace Processor
+
+_The Trace Processor is a C++ library
+([/src/trace_processor](/src/trace_processor)) that ingests traces encoded in a
+wide variety of formats and exposes an SQL interface for querying trace events
+contained in a consistent set of tables. It also has other features including
+computation of summary metrics, annotating the trace with user-friendly
+descriptions and deriving new events from the contents of the trace._
+
+
+
+## Quickstart
+
+The [quickstart](/docs/quickstart/trace-analysis.md) provides a quick overview
+on how to run SQL queries against traces using trace processor.
+
+## Introduction
+
+Events in a trace are optimized for fast, low-overhead recording. Therefore
+traces need significant data processing to extract meaningful information from
+them. This is compounded by the number of legacy formats which are still in use and
+need to be supported in trace analysis tools.
+
+The trace processor abstracts this complexity by parsing traces, extracting the
+data inside, and exposing it in a set of database tables which can be queried
+with SQL.
+
+Features of the trace processor include:
+
+* Execution of SQL queries on a custom, in-memory, columnar database backed by
+ the SQLite query engine.
+* Metrics subsystem which allows computation of summarized view of the trace
+ (e.g. CPU or memory usage of a process, time taken for app startup etc.).
+* Annotating events in the trace with user-friendly descriptions, providing
+ context and explanation of events to newer users.
+* Creation of new events derived from the contents of the trace.
+
+The formats supported by trace processor include:
+
+* Perfetto native protobuf format
+* Linux ftrace
+* Android systrace
+* Chrome JSON (including JSON embedding Android systrace text)
+* Fuchsia binary format
+* [Ninja](https://ninja-build.org/) logs (the build system)
+
+The trace processor is embedded in a wide variety of trace analysis tools, including:
+
+* [trace_processor](/docs/analysis/trace-processor.md), a standalone binary
+ providing a shell interface (and the reference embedder).
+* [Perfetto UI](https://ui.perfetto.dev), in the form of a WebAssembly module.
+* [Android Graphics Inspector](https://gpuinspector.dev/).
+* [Android Studio](https://developer.android.com/studio/).
+
+## Concepts
+
+The trace processor has some foundational terminology and concepts which are
+used in the rest of documentation.
+
+### Events
+
+In the most general sense, a trace is simply a collection of timestamped
+"events". Events can have associated metadata and context which allows them to
+be interpreted and analyzed.
+
+Events form the foundation of trace processor and are one of two types: slices
+and counters.
+
+#### Slices
+
+
+
+A slice refers to an interval of time with some data describing what was
+happening in that interval. Some example of slices include:
+
+* Scheduling slices for each CPU
+* Atrace slices on Android
+* Userspace slices from Chrome
+
+#### Counters
+
+
+
+A counter is a continuous value which varies over time. Some examples of
+counters include:
+
+* CPU frequency for each CPU core
+* RSS memory events - both from the kernel and polled from /proc/stats
+* atrace counter events from Android
+* Chrome counter events
+
+### Tracks
+
+A track is a named partition of events of the same type and the same associated
+context. For example:
+
+* Scheduling slices have one track for each CPU
+* Sync userspace slice have one track for each thread which emitted an event
+* Async userspace slices have one track for each “cookie” linking a set of async
+ events
+
+The most intuitive way to think of a track is to imagine how they would be drawn
+in a UI; if all the events are in a single row, they belong to the same track.
+For example, all the scheduling events for CPU 5 are on the same track:
+
+
+
+Tracks can be split into various types based on the type of event they contain
+and the context they are associated with. Examples include:
+
+* Global tracks are not associated to any context and contain slices
+* Thread tracks are associated to a single thread and contain slices
+* Counter tracks are not associated to any context and contain counters
+* CPU counter tracks are associated to a single CPU and contain counters
+
+### Thread and process identifiers
+
+The handling of threads and processes needs special care when considered in the
+context of tracing; identifiers for threads and processes (e.g. `pid`/`tgid` and
+`tid` in Android/macOS/Linux) can be reused by the operating system over the
+course of a trace. This means they cannot be relied upon as a unique identifier
+when querying tables in trace processor.
+
+To solve this problem, the trace processor uses `utid` (_unique_ tid) for
+threads and `upid` (_unique_ pid) for processes. All references to threads and
+processes (e.g. in CPU scheduling data, thread tracks) uses `utid` and `upid`
+instead of the system identifiers.
+
+## Object-oriented tables
+
+Modeling an object with many types is a common problem in trace processor. For
+example, tracks can come in many varieties (thread tracks, process tracks,
+counter tracks etc). Each type has a piece of data associated to it unique to
+that type; for example, thread tracks have a `utid` of the thread, counter
+tracks have the `unit` of the counter.
+
+To solve this problem in object-oriented languages, a `Track` class could be
+created and inheritance used for all subclasses (e.g. `ThreadTrack` and
+`CounterTrack` being subclasses of `Track`, `ProcessCounterTrack` being a
+subclass of `CounterTrack` etc).
+
+
+
+In trace processor, this "object-oriented" approach is replicated by having
+different tables for each type of object. For example, we have a `track` table
+as the "root" of the hierarchy with the `thread_track` and `counter_track`
+tables "inheriting from" the `track` table.
+
+NOTE: [The appendix below](#appendix-table-inheritance) gives the exact rules
+for inheritance between tables for interested readers.
+
+Inheritance between the tables works in the natural way (i.e. how it works in
+OO languages) and is best summarized by a diagram.
+
+
+
+NOTE: For an up-to-date of how tables currently inherit from each other as well
+as a comprehensive reference of all the column and how they are inherited see
+the [SQL tables](/docs/analysis/sql-tables.autogen) reference page.
+
+## Writing Queries
+
+### Context using tracks
+
+A common question when querying tables in trace processor is: "how do I obtain
+the process or thread for a slice?". Phrased more generally, the question is
+"how do I get the context for an event?".
+
+In trace processor, any context associated with all events on a track is found
+on the associated `track` tables.
+
+For example, to obtain the `utid` of any thread which emitted a `measure` slice
+
+```sql
+SELECT utid
+FROM slice
+JOIN thread_track ON thread_track.id = slice.track_id
+WHERE slice.name = 'measure'
+```
+
+Similarly, to obtain the `upid`s of any process which has a `mem.swap` counter
+greater than 1000
+
+```sql
+SELECT upid
+FROM counter
+JOIN process_counter_track ON process_counter_track.id = slice.track_id
+WHERE process_counter_track.name = 'mem.swap' AND value > 1000
+```
+
+If the source and type of the event is known beforehand (which is generally the
+case), the following can be used to find the `track` table to join with
+
+| Event type | Associated with | Track table | Constraint in WHERE clause |
+| :--------- | ------------------ | --------------------- | -------------------------- |
+| slice | N/A (global scope) | track | `type = 'track'` |
+| slice | thread | thread_track | N/A |
+| slice | process | process_track | N/A |
+| counter | N/A (global scope) | counter_track | `type = 'counter_track'` |
+| counter | thread | thread_counter_track | N/A |
+| counter | process | process_counter_track | N/A |
+| counter | cpu | cpu_counter_track | N/A |
+
+On the other hand, sometimes the source is not known. In this case, joining with
+the `track `table and looking up the `type` column will give the exact track
+table to join with.
+
+For example, to find the type of track for `measure` events, the following query
+could be used.
+
+```sql
+SELECT type
+FROM slice
+JOIN track ON track.id = slice.track_id
+WHERE slice.name = 'measure'
+```
+
+### Thread and process tables
+
+While obtaining `utid`s and `upid`s are a step in the right direction, generally
+users want the original `tid`, `pid`, and process/thread names.
+
+The `thread` and `process` tables map `utid`s and `upid`s to threads and
+processes respectively. For example, to lookup the thread with `utid` 10
+
+```sql
+SELECT tid, name
+FROM thread
+WHERE utid = 10
+```
+
+The `thread` and `process` tables can also be joined with the associated track
+tables directly to jump directly from the slice or counter to the information
+about processes and threads.
+
+For example, to get a list of all the threads which emitted a `measure` slice
+
+```sql
+SELECT thread.name AS thread_name
+FROM slice
+JOIN thread_track ON slice.track_id = thread_track.id
+JOIN thread USING(utid)
+WHERE slice.name = 'measure'
+GROUP BY thread_name
+```
+
+## Metrics
+
+TIP: To see how to add to add a new metric to trace processor, see the checklist
+[here](/docs/contributing/common-tasks.md#new-metric).
+
+The metrics subsystem is a significant part of trace processor and thus is
+documented on its own [page](/docs/analysis/metrics.md).
+
+## Annotations
+
+TIP: To see how to add to add a new annotation to trace processor, see the
+checklist [here](/docs/contributing/common-tasks.md#new-annotation).
+
+Annotations attach a human-readable description to a slice in the trace. This
+can include information like the source of a slice, why a slice is important and
+links to documentation where the viewer can learn more about the slice.
+In essence, descriptions act as if an expert was telling the user what the slice
+means.
+
+For example, consider the `inflate` slice which occurs during view inflation in
+Android. We can add the following description and link:
+
+**Description**: Constructing a View hierarchy from pre-processed XML via
+LayoutInflater#layout. This includes constructing all of the View objects in the
+hierarchy, and applying styled attributes.
+
+## Creating derived events
+
+TIP: To see how to add to add a new annotation to trace processor, see the
+ checklist [here](/docs/contributing/common-tasks.md#new-annotation).
+
+This feature allows creation of new events (slices and counters) from the data
+in the trace. These events can then be displayed in the UI tracks as if they
+were part of the trace itself.
+
+This is useful as often the data in the trace is very low-level. While low
+level information is important for experts to perform deep debugging, often
+users are just looking for a high level overview without needing to consider
+events from multiple locations.
+
+For example, an app startup in Android spans multiple components including
+`ActivityManager`, `system_server`, and the newly created app process derived
+from `zygote`. Most users do not need this level of detail; they are only
+interested in a single slice spanning the entire startup.
+
+Creating derived events is tied very closely to
+[metrics subsystem](/docs/analysis/metrics.md); often SQL-based metrics need to
+create higher-level abstractions from raw events as intermediate artifacts.
+
+From previous example, the
+[startup metric](/src/trace_processor/metrics/android/android_startup.sql)
+creates the exact `launching` slice we want to display in the UI.
+
+The other benefit of aligning the two is that changes in metrics are
+automatically kept in sync with what the user sees in the UI.
+
+## Alerts
+
+Alerts are used to draw the attention of the user to interesting parts of the
+trace; this are usually warnings or errors about anomalies which occurred in the
+trace.
+
+Currently, alerts are not implemented in the trace processor but the API to
+create derived events was designed with them in mind. We plan on adding another
+column `alert_type` (name to be finalized) to the annotations table which can
+have the value `warning`, `error` or `null`. Depending on this value, the
+Perfetto UI will flag these events to the user.
+
+NOTE: we do not plan on supporting case where alerts need to be added to
+ existing events. Instead, new events should be created using annotations
+ and alerts added on these instead; this is because the trace processor
+ storage is monotonic-append-only.
+
+## Appendix: table inheritance
+
+Concretely, the rules for inheritance between tables works are as follows:
+
+* Every row in a table has an `id` which is unique for a hierarchy of tables.
+ * For example, every `track` will have an `id` which is unique among all
+ tracks (regardless of the type of track)
+* If a table C inherits from P, each row in C will also be in P _with the same
+ id_
+ * This allows for ids to act as "pointers" to rows; lookups by id can be
+ performed on any table which has that row
+ * For example, every `process_counter_track` row will have a matching row in
+ `counter_track` which will itself have matching rows in `track`
+* If a table C with columns `A` and `B` inherits from P with column `A`, `A`
+ will have the same data in both C and P
+ * For example, suppose
+ * `process_counter_track` has columns `name`, `unit` and `upid`
+ * `counter_track` has `name` and `unit`
+ * `track` has `name`
+ * Every row in `process_counter_track` will have the same `name` for the row
+ with the same id in `track` and `counter_track`
+ * Similarly, every row in `process_counter_track` will have both the same
+ `name ` and `unit` for the row with the same id in `counter_track`
+* Every row in a table has a `type` column. This specifies the _most specific_
+ table this row belongs to.
+ * This allows _dynamic casting_ of a row to its most specific type
+ * For example, for if a row in the `track` is actually a
+ `process_counter_track`, it's type column will be `process_counter_track`.
diff --git a/docs/app-instrumentation.md b/docs/app-instrumentation.md
deleted file mode 100644
index 922f366..0000000
--- a/docs/app-instrumentation.md
+++ /dev/null
@@ -1,574 +0,0 @@
-# App instrumentation
-
-The Perfetto Client API is a C++ library that allows applications to emit
-trace events to add more context to a Perfetto trace to help with
-development, debugging and performance analysis.
-
-> The code from this example is also available as a [GitHub repository](
-> https://github.com/skyostil/perfetto-sdk-example).
-
-To start using the Client API, first check out the latest SDK release:
-
-```sh
-$ git clone https://android.googlesource.com/platform/external/perfetto -b latest
-```
-
-The SDK consists of two files, `sdk/perfetto.h` and
-`sdk/perfetto.cc`. These are an amalgamation of the Client API designed to
-easy to integrate to existing build systems. For example, to add the SDK to a
-CMake project, edit your `CMakeLists.txt` accordingly:
-
-```cmake
-cmake_minimum_required(VERSION 3.13)
-project(PerfettoExample)
-find_package(Threads)
-
-# Define a static library for Perfetto.
-include_directories(perfetto/sdk)
-add_library(perfetto STATIC perfetto/sdk/perfetto.cc)
-
-# Link the library to your main executable.
-add_executable(example example.cc)
-target_link_libraries(example perfetto ${CMAKE_THREAD_LIBS_INIT})
-```
-
-Next, initialize Perfetto in your program:
-
-```C++
-
-#include <perfetto.h>
-
-int main(int argv, char** argc) {
- perfetto::TracingInitArgs args;
-
- // The backends determine where trace events are recorded. You may select one
- // or more of:
-
- // 1) The in-process backend only records within the app itself.
- args.backends |= perfetto::kInProcessBackend;
-
- // 2) The system backend writes events into a system Perfetto daemon,
- // allowing merging app and system events (e.g., ftrace) on the same
- // timeline. Requires the Perfetto `traced` daemon to be running (e.g.,
- // on Android Pie and newer).
- args.backends |= perfetto::kSystemBackend;
-
- perfetto::Tracing::Initialize(args);
-}
-```
-
-You are now ready to instrument your app with trace events. The Client API
-has two options for this:
-
-- [Track events](#track-events), which represent time-bounded operations
- (e.g., function calls) on a timeline. Track events are a good choice for
- most apps.
-
-- [Custom data sources](#custom-data-sources), which can be used to
- efficiently record arbitrary app-defined data using a protobuf encoding.
- Custom data sources are a typically better match for advanced Perfetto
- users.
-
-# Track events
-
-
-
-*Track events* are application specific, time bounded events recorded into a
-*trace* while the application is running. Track events are always associated
-with a *track*, which is a timeline of monotonically increasing time. A track
-corresponds to an independent sequence of execution, such as a single thread
-in a process.
-
-There are a few main types of track events:
-
-1. **Slices**, which represent nested, time bounded operations. For example,
- a slice could cover the time period from when a function begins executing
- to when it returns, the time spent loading a file from the network or the
- time spent blocked on a disk read.
-
-2. **Counters**, which are snapshots of time-varying numeric values. For
- example, a track event can record instantaneous the memory usage of a
- process during its execution.
-
-3. **Flows**, which are used to connect related slices that span different
- tracks together. For example, if an image file is first loaded from
- the network and then decoded on a thread pool, a flow event can be used to
- highlight its path through the system. (Not fully implemented yet).
-
-The [Perfetto UI](https://ui.perfetto.dev) has built in support for track
-events, which provides a useful way to quickly visualize the internal
-processing of an app. For example, the [Chrome
-browser](https://www.chromium.org/developers/how-tos/trace-event-profiling-tool)
-is deeply instrumented with track events to assist in debugging, development
-and performance analysis.
-
-A typical use case for track events is annotating a function with a scoped
-track event, so that function's execution shows up in a trace. To start using
-track events, first define the set of categories that your events will fall
-into. Each category can be separately enabled or disabled for tracing (see
-[Category configuration](#category-configuration).
-
-Add the list of categories into a header file (e.g., `example_tracing.h`)
-like this:
-
-```C++
-#include <perfetto.h>
-
-PERFETTO_DEFINE_CATEGORIES(
- perfetto::Category("rendering")
- .SetDescription("Events from the graphics subsystem"),
- perfetto::Category("network")
- .SetDescription("Network upload and download statistics"));
-```
-
-Then, declare static storage for the categories in a cc file (e.g.,
-`example_tracing.cc`):
-
-```C++
-#include "example_tracing.h"
-
-PERFETTO_TRACK_EVENT_STATIC_STORAGE();
-```
-
-Finally, initialize track events after the client library is brought up:
-
-```C++
-int main(int argv, char** argc) {
- ...
- perfetto::Tracing::Initialize(args);
- perfetto::TrackEvent::Register(); // Add this.
-}
-```
-
-Now you can add track events to existing functions like this:
-
-```C++
-#include "example_tracing.h"
-
-void DrawPlayer() {
- TRACE_EVENT("rendering", "DrawPlayer");
- ...
-}
-```
-
-This type of trace event is scoped, which means it will cover the time from
-when the function began executing until the point of return. You can also
-supply (up to two) debug annotations together with the event.
-
-```C++
-int player_number = 1;
-TRACE_EVENT("rendering", "DrawPlayer", "player_number", player_number);
-```
-
-For more complex arguments, you can define [your own protobuf
-messages](../protos/perfetto/trace/track_event/track_event.proto) and emit
-them as a parameter for the event.
-
-> Currently custom protobuf messages need to be added directly to the
-> Perfetto repository under `protos/perfetto/trace`, and Perfetto itself must
-> also be rebuilt. We are working [to lift this
-> limitation](https://github.com/google/perfetto/issues/11).
-
-As an example of a custom track event argument type, save the following as
-`protos/perfetto/trace/track_event/player_info.proto`:
-
-```protobuf
-message PlayerInfo {
- optional string name = 1;
- optional uint64 score = 2;
-}
-```
-
-This new file should also be added to
-`protos/perfetto/trace/track_event/BUILD.gn`:
-
-```json
-sources = [
- ...
- "player_info.proto"
-]
-```
-
-Also, a matching argument should be added to the track event message
-definition in
-`protos/perfetto/trace/track_event/track_event.proto`:
-
-```protobuf
-import "protos/perfetto/trace/track_event/player_info.proto";
-
-...
-
-message TrackEvent {
- ...
- // New argument types go here :)
- optional PlayerInfo player_info = 1000;
-}
-```
-
-The corresponding trace point could look like this:
-
-```C++
-Player my_player;
-TRACE_EVENT("category", "MyEvent", [&](perfetto::EventContext ctx) {
- auto player = ctx.event()->set_player_info();
- player->set_name(my_player.name());
- player->set_player_score(my_player.score());
-});
-```
-
-The lambda function passed to the macro is only called if tracing is enabled for
-the given category. It is always called synchronously and possibly multiple
-times if multiple concurrent tracing sessions are active.
-
-Now that you have instrumented your app with track events, you are ready to
-start [recording traces](recording-traces.md).
-
-## Category configuration
-
-All track events are assigned to one more trace categories. For example:
-
-```C++
-TRACE_EVENT("rendering", ...); // Event in the "rendering" category.
-```
-
-By default, all non-debug and non-slow track event categories are enabled for
-tracing. *Debug* and *slow* categories are categories with special tags:
-
- - `"debug"` categories can give more verbose debugging output for a particular
- subsystem.
- - `"slow"` categories record enough data that they can affect the interactive
- performance of your app.
-
-Category tags can be can be defined like this:
-
-```C++
-perfetto::Category("rendering.debug")
- .SetDescription("Debug events from the graphics subsystem")
- .SetTags("debug", "my_custom_tag")
-```
-
-A single trace event can also belong to multiple categories:
-
-```C++
-// Event in the "rendering" and "benchmark" categories.
-TRACE_EVENT("rendering,benchmark", ...);
-```
-
-A corresponding category group entry must be added to the category registry:
-
-```C++
-perfetto::Category::Group("rendering,benchmark")
-```
-
-It's also possible to efficiently query whether a given category is enabled
-for tracing:
-
-```C++
-if (TRACE_EVENT_CATEGORY_ENABLED("rendering")) {
- // ...
-}
-```
-
-The `TrackEventConfig` field in Perfetto's `TraceConfig` can be used to
-select which categories are enabled for tracing:
-
-```protobuf
-message TrackEventConfig {
- // Each list item is a glob. Each category is matched against the lists
- // as explained below.
- repeated string disabled_categories = 1; // Default: []
- repeated string enabled_categories = 2; // Default: []
- repeated string disabled_tags = 3; // Default: [“slow”, “debug”]
- repeated string enabled_tags = 4; // Default: []
-}
-```
-
-To determine if a category is enabled, it is checked against the filters in the
-following order:
-
-1. Exact matches in enabled categories.
-2. Exact matches in enabled tags.
-3. Exact matches in disabled categories.
-4. Exact matches in disabled tags.
-5. Pattern matches in enabled categories.
-6. Pattern matches in enabled tags.
-7. Pattern matches in disabled categories.
-8. Pattern matches in disabled tags.
-
-If none of the steps produced a match, the category is enabled by default. In
-other words, every category is implicitly enabled unless specifically disabled.
-For example:
-
-| Setting | Needed configuration |
-| ------------------------------- | -------------------------------------------- |
-| Enable just specific categories | `enabled_categories = [“foo”, “bar”, “baz”]` |
-| | `disabled_categories = [“*”]` |
-| Enable all non-slow categories | (Happens by default.) |
-| Enable specific tags | `disabled_tags = [“*”]` |
-| | `enabled_tags = [“foo”, “bar”]` |
-
-## Dynamic and test-only categories
-
-Ideally all trace categories should be defined at compile time as shown
-above, as this ensures trace points will have minimal runtime and binary size
-overhead. However, in some cases trace categories can only be determined at
-runtime (e.g., by JavaScript). These can be used by trace points as follows:
-
-```C++
-perfetto::DynamicCategory dynamic_category{"nodejs.something"};
-TRACE_EVENT(dynamic_category, "SomeEvent", ...);
-```
-
-> Tip: It's also possible to use dynamic event names by passing `nullptr` as
-> the name and filling in the `TrackEvent::name` field manually.
-
-Some trace categories are only useful for testing, and they should not make
-it into a production binary. These types of categories can be defined with a
-list of prefix strings:
-
-```C++
-PERFETTO_DEFINE_TEST_CATEGORY_PREFIXES(
- "test",
- "cat"
-);
-```
-
-# Custom data sources
-
-For most uses, track events are the most straightforward way of instrumenting
-your app for tracing. However, in some rare circumstances they are not
-flexible enough, e.g., when the data doesn't fit the notion of a track or is
-high volume enough that it need strongly typed schema to minimize the size of
-each event. In this case, you can implement a *custom data source* for
-Perfetto.
-
-Note that when working with custom data sources, you will also need
-corresponding changes in [trace processor](trace-processor.md) to enable
-importing your data format.
-
-A custom data source is a subclass of `perfetto::DataSource`. Perfetto with
-automatically create one instance of the class for each tracing session it is
-active in (usually just one).
-
-```C++
-class CustomDataSource : public perfetto::DataSource<CustomDataSource> {
- public:
- void OnSetup(const SetupArgs&) override {
- // Use this callback to apply any custom configuration to your data source
- // based on the TraceConfig in SetupArgs.
- }
-
- void OnStart(const StartArgs&) override {
- // This notification can be used to initialize the GPU driver, enable
- // counters, etc. StartArgs will contains the DataSourceDescriptor,
- // which can be extended.
- }
-
- void OnStop(const StopArgs&) override {
- // Undo any initialization done in OnStart.
- }
-
- // Data sources can also have per-instance state.
- int my_custom_state = 0;
-};
-
-PERFETTO_DECLARE_DATA_SOURCE_STATIC_MEMBERS(CustomDataSource);
-```
-
-The data source's static data should be defined in one source file like this:
-
-```C++
-PERFETTO_DEFINE_DATA_SOURCE_STATIC_MEMBERS(CustomDataSource);
-```
-
-Custom data sources need to be registered with Perfetto:
-
-```C++
-int main(int argv, char** argc) {
- ...
- perfetto::Tracing::Initialize(args);
- // Add the following:
- perfetto::DataSourceDescriptor dsd;
- dsd.set_name("com.example.custom_data_source");
- CustomDataSource::Register(dsd);
-}
-```
-
-As with all data sources, the custom data source needs to be specified in the
-trace config to enable tracing:
-
-```C++
-perfetto::TraceConfig cfg;
-auto* ds_cfg = cfg.add_data_sources()->mutable_config();
-ds_cfg->set_name("com.example.custom_data_source");
-```
-
-Finally, call the `Trace()` method to record an event with your custom data
-source. The lambda function passed to that method will only be called if tracing
-is enabled. It is always called synchronously and possibly multiple times if
-multiple concurrent tracing sessions are active.
-
-```C++
-CustomDataSource::Trace([](CustomDataSource::TraceContext ctx) {
- auto packet = ctx.NewTracePacket();
- packet->set_timestamp(perfetto::TrackEvent::GetTraceTimeNs());
- packet->set_for_testing()->set_str("Hello world!");
-});
-```
-
-If necessary the `Trace()` method can access the custom data source state
-(`my_custom_state` in the example above). Doing so, will take a mutex to
-ensure data source isn't destroyed (e.g., because of stopping tracing) while
-the `Trace()` method is called on another thread. For example:
-
-```C++
-CustomDataSource::Trace([](CustomDataSource::TraceContext ctx) {
- auto safe_handle = trace_args.GetDataSourceLocked(); // Holds a RAII lock.
- DoSomethingWith(safe_handle->my_custom_state);
-});
-```
-
-# Performance
-
-Perfetto's trace points are designed to have minimal overhead when tracing is
-disabled while providing high throughput for data intensive tracing use
-cases. While exact timings will depend on your system, there is a
-[microbenchmark](../src/tracing/api_benchmark.cc) which gives some ballpark
-figures:
-
-| Scenario | Runtime on Pixel 3 XL | Runtime on ThinkStation P920 |
-| -------- | --------------------- | ---------------------------- |
-| `TRACE_EVENT(...)` (disabled) | 2 ns | 1 ns |
-| `TRACE_EVENT("cat", "name")` | 285 ns | 630 ns |
-| `TRACE_EVENT("cat", "name", <lambda>)` | 304 ns | 663 ns |
-| `TRACE_EVENT("cat", "name", "key", value)` | 354 ns | 664 ns |
-| `DataSource::Trace(<lambda>)` (disabled) | 2 ns | 1 ns |
-| `DataSource::Trace(<lambda>)` | 133 ns | 58 ns |
-
-# Advanced topics
-
-## Tracks
-
-Every track event is associated with a track, which specifies the timeline
-the event belongs to. In most cases, a track corresponds to a visual
-horizontal track in the Perfetto UI like this:
-
-
-
-Events that describe parallel sequences (e.g., separate
-threads) should use separate tracks, while sequential events (e.g., nested
-function calls) generally belong on the same track.
-
-Perfetto supports three kinds of tracks:
-
-1. `Track` – a basic timeline.
-
-2. `ProcessTrack` – a timeline that represents a single process in the system.
-
-3. `ThreadTrack` – a timeline that represents a single thread in the system.
-
-Tracks can have a parent track, which is used to group related tracks
-together. For example, the parent of a `ThreadTrack` is the `ProcessTrack` of
-the process the thread belongs to. By default, tracks are grouped under the
-current process's `ProcessTrack`.
-
-A track is identified by a uuid, which must be unique across the entire
-recorded trace. To minimize the chances of accidental collisions, the uuids
-of child tracks are combined with those of their parents, with each
-`ProcessTrack` having a random, per-process uuid.
-
-By default, track events (e.g., `TRACE_EVENT`) use the `ThreadTrack` for the
-calling thread. This can be overridden, for example, to mark events that
-begin and end on a different thread:
-
-```C++
-void OnNewRequest(size_t request_id) {
- // Open a slice when the request came in.
- TRACE_EVENT_BEGIN("category", "HandleRequest", perfetto::Track(request_id));
-
- // Start a thread to handle the request.
- std::thread worker_thread([=] {
- // ... produce response ...
-
- // Close the slice for the request now that we finished handling it.
- TRACE_EVENT_END("category", perfetto::Track(request_id));
- });
-```
-Tracks can also optionally be annotated with metadata:
-
-```C++
-auto desc = track.Serialize();
-desc.set_name("MyTrack");
-perfetto::TrackEvent::SetTrackDescriptor(track, desc);
-```
-
-Threads and processes can also be named in a similar way, e.g.:
-
-```C++
-auto desc = perfetto::ProcessTrack::Current().Serialize();
-desc.mutable_process()->set_process_name("MyProcess");
-perfetto::TrackEvent::SetTrackDescriptor(
- perfetto::ProcessTrack::Current(), desc);
-```
-
-The metadata remains valid between tracing sessions. To free up data for a
-track, call EraseTrackDescriptor:
-
-```C++
-perfetto::TrackEvent::EraseTrackDescriptor(track);
-```
-
-## Interning
-
-Interning can be used to avoid repeating the same constant data (e.g., event
-names) throughout the trace. Perfetto automatically performs interning for
-most strings passed to `TRACE_EVENT`, but it's also possible to also define
-your own types of interned data.
-
-First, define an interning index for your type. It should map to a specific
-field of
-[interned_data.proto](../protos/perfetto/trace/interned_data/interned_data.proto)
-and specify how the interned data is written into that message when seen for
-the first time.
-
-```C++
-struct MyInternedData
- : public perfetto::TrackEventInternedDataIndex<
- MyInternedData,
- perfetto::protos::pbzero::InternedData::kMyInternedDataFieldNumber,
- const char*> {
- static void Add(perfetto::protos::pbzero::InternedData* interned_data,
- size_t iid,
- const char* value) {
- auto my_data = interned_data->add_my_interned_data();
- my_data->set_iid(iid);
- my_data->set_value(value);
- }
-};
-```
-
-Next, use your interned data in a trace point as shown below. The interned
-string will only be emitted the first time the trace point is hit (unless the
-trace buffer has wrapped around).
-
-```C++
-TRACE_EVENT(
- "category", "Event", [&](perfetto::EventContext ctx) {
- auto my_message = ctx.event()->set_my_message();
- size_t iid = MyInternedData::Get(&ctx, "Repeated data to be interned");
- my_message->set_iid(iid);
- });
-```
-
-Note that interned data is strongly typed, i.e., each class of interned data
-uses a separate namespace for identifiers.
-
-## Counters
-
-TODO(skyostil).
-
-## Flow events
-
-TODO(skyostil).
diff --git a/docs/architecture.md b/docs/architecture.md
deleted file mode 100644
index 7d57bad..0000000
--- a/docs/architecture.md
+++ /dev/null
@@ -1,121 +0,0 @@
-# Perfetto key concepts and architecture
-
-Producer <> Service <> Consumer model
--------------------------------------
-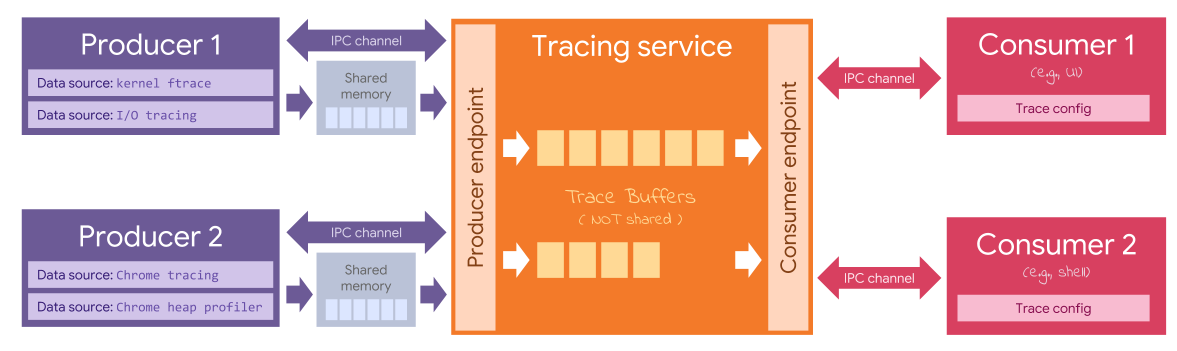
-
-**Service**
-The tracing service is a long-lived entity (a system daemon on Linux/Android,
-a service in Chrome) that has the following responsibilities:
-- Maintains a registry of active producers and their data sources.
-- Owns the trace buffers.
-- Handles multiplexing of several tracing sessions.
-- Routes the trace config from the consumers to the corresponding producers.
-- Tells the Producers when and what to trace.
-- Moves data from the Producer's shared memory buffer to the central non-shared
- trace buffers.
-
-**Producer**
-A producer is an untrusted entity that offers the ability to contribute to the
-trace. In a multiprocess model, a producer almost always corresponds to a client
-process of the tracing service. It advertises its ability to contribute to the trace with one or more data sources.
-Each producer has exactly:
-- One shared memory buffer, shared exclusively with the tracing service.
-- One IPC channel with the tracing service.
-
-A producer is completely decoupled (both technically and conceptually) from
-consumer(s). A producer knows nothing about:
-- How many consumer(s) are connected to the service.
-- How many tracing sessions are active.
-- How many other producer(s) are registered or active.
-- Trace data written by other producer(s).
-
-*** aside
-In rare circumstances a process can host more than one producer and hence more
-than one shared memory buffer. This can be the case for a process bundling
-third-party libraries that in turn include the Perfetto client library.
-Concrete example: at some point in the future Chrome might expose one Producer for tracing within the main project, one for V8 and one for Skia (for each child
-process).
-***
-
-**Consumer**
-A consumer is a trusted entity (a cmdline client on Linux/Android, an interface
-of the Browser process in Chrome) that controls (non-exclusively) the tracing service and reads back (destructively) the trace buffers.
-A consumer has the ability to:
-- Send a [trace config](trace-config.md) to the service, determining:
- - How many trace buffers to create.
- - How big the trace buffers should be.
- - The policy for each buffer (*ring-buffer* or *stop-when-full*).
- - Which data sources to enable.
- - The configuration for each data source.
- - The target buffer for the data produced by each data source configured.
-- Enable and disable tracing.
-- Read back the trace buffers:
- - Streaming data over the IPC channel.
- - Passing a file descriptor to the service and instructing it to periodically
- save the trace buffers into the file.
-
-**Data source**
-A data source is a capability, exposed by a Producer, of providing some tracing
-data. A data source almost always defines its own schema (a protobuf) consisting
-of:
-- At most one `DataSourceConfig` sub-message
- ([example](/protos/perfetto/config/ftrace/ftrace_config.proto))
-- One or more `TracePacket` sub-messages
- ([example](/protos/perfetto/trace/ps/process_tree.proto))
-
-Different producers may expose the same data source. Concrete example:
-*** aside
-At some point in the near future we might offer, as part of Perfetto, a library
-for in-process heap profiling. In such case more than one producer, linking
-against the updated Perfetto library, will expose the heap profiler data source,
-for its own process.
-***
-
-**IPC channel**
-In a multiprocess scenario, each producer and each consumer interact with the
-service using an IPC channel. IPC is used only in non-fast-path interactions,
-mostly handshakes such as enabling/disabling trace (consumer), (un)registering
-and starting/stopping data sources (producer). The IPC is typically NOT employed
-to transport the protobufs for the trace.
-Perfetto provides a POSIX-friendly IPC implementation, based on protobufs over a
-UNIX socket (see [ipc.md](ipc.md)). That IPC implementation is not mandated.
-Perfetto allows the embedder:
-- Wrap its own IPC subsystem (e.g., Perfetto in Chromium uses Mojo)
-- Not use an IPC mechanism at all and just short circuit the
- Producer <> Service <> Consumer interaction via `PostTask(s)`.
-
-See [embedder-guide.md](embedder-guide.md) for more details.
-
-
-**Shared memory buffer**
-Producer(s) write tracing data, in the form of protobuf-encoded binary blobs,
-directly into its shared memory buffer, using a special library called
-[ProtoZero](protozero.md). The shared memory buffer:
-- Has a fixed and typically small size (configurable, default: 128 KB).
-- Is an ABI and must maintain backwards compatibility.
-- Is shared by all data sources of the producer.
-- Is independent of the number and the size of the trace buffers.
-- Is independent of the number of Consumer(s).
-- Is partitioned in *chunks* of variable size.
-
-Each chunk:
-- Is owned exclusively by one Producer thread (or shared through a mutex).
-- Contains a linear sequence of [`TracePacket(s)`](trace-format.md), or
- fragments of that. A `TracePacket` can span across several chunks, the
- fragmentation is not exposed to the consumers (consumers always see whole
- packets as if they were never fragmented).
-- Can be owned and written by exactly one `TraceWriter`.
-- Is part of a reliable and ordered sequence, identified by the `WriterID`:
- packets in a sequence are guaranteed to be read back in order, without gaps
- and without repetitions (see [trace-format.md](trace-format.md) for more).
-
-See the comments in
-[shared_memory_abi.h](/include/perfetto/ext/tracing/core/shared_memory_abi.h)
-for more details about the binary format of this buffer.
-
-Other resources
----------------
-* [Life of a tracing session](life-of-a-tracing-session.md)
-* [Trace config](trace-config.md)
-* [Trace format](trace-format.md)
diff --git a/docs/benchmarks.md b/docs/benchmarks.md
deleted file mode 100644
index 0280a54..0000000
--- a/docs/benchmarks.md
+++ /dev/null
@@ -1,35 +0,0 @@
-# Perfetto benchmarks
-
-
-*** note
-**This doc is WIP**, stay tuned.
-<!-- TODO(primiano): Summarize results of perfetto_benchmarks  -->
-***
-
-This doc should show the charts of `perfetto_benchmarks`, showing cpu usage and
-tracing bandwidth for both writing (producer->service) and reading
-(service->file / service->consumer).
-
-In two modes:
-- Measure peak tracing bandwidth saturating the cpu: the producer(s) write as
-  much data as they can, reaching 100% cpu usage.
-- Measure CPU overhead vs constant bandwidth: the producer(s) writes data at a
-  pre-defined rate.
-
-Tweaking the various parameters, such as:
-- Number of writers
-- Size of the shared memory buffer
-- Size of each TracePacket.
-
-**TL;DR:**
-Peak producer-to-service tracing bandwidth:
-* Linux desktop: ~1.3 GB/s
-* Android Pixel: ~1 GB/s
-
-Producer-to-service CPU overhead when writing ~3 MB/s: 0.01 - 0.03
-(0.01 := 1% cpu time of one core)
-
-CPU overhead for translating ftrace raw pipe into protobuf:
-* Android Pixel: 0.00-0.01 when idle.
-* Android Pixel: 0.02-0.04 with 8 cores @ 8.0 CPU usage (raytracer).
-* Linux desktop: TBD
diff --git a/docs/case-studies/memory.md b/docs/case-studies/memory.md
new file mode 100644
index 0000000..2be47bf
--- /dev/null
+++ b/docs/case-studies/memory.md
@@ -0,0 +1,435 @@
+# Debugging memory usage on Android
+
+## Prerequisites
+
+* A host running macOS or Linux.
+* A device running Android 11+.
+
+If you are profiling your own app and are not running a userdebug build of
+Android, your app needs to be marked as profileable or
+debuggable in its manifest. See the [heapprofd documentation](
+/docs/data-sources/native-heap-profiler.md#heapprofd-targets) for more
+details on which applications can be targeted.
+
+## dumpsys meminfo
+
+A good place to get started investigating memory usage of a process is
+`dumpsys meminfo` which gives a high-level overview of how much of the various
+types of memory are being used by a process.
+
+```bash
+$ adb shell dumpsys meminfo com.android.systemui
+
+Applications Memory Usage (in Kilobytes):
+Uptime: 2030149 Realtime: 2030149
+
+** MEMINFO in pid 1974 [com.android.systemui] **
+ Pss Private Private SwapPss Rss Heap Heap Heap
+ Total Dirty Clean Dirty Total Size Alloc Free
+ ------ ------ ------ ------ ------ ------ ------ ------
+ Native Heap 16840 16804 0 6764 19428 34024 25037 5553
+ Dalvik Heap 9110 9032 0 136 13164 36444 9111 27333
+
+[more stuff...]
+```
+
+Looking at the "Private Dirty" column of Dalvik Heap (= Java Heap) and
+Native Heap, we can see that SystemUI's memory usage on the Java heap
+is 9M, on the native heap it's 17M.
+
+## Linux memory management
+
+But what does *clean*, *dirty*, *Rss*, *Pss*, *Swap* actually mean? To answer
+this question, we need to delve into Linux memory management a bit.
+
+From the kernel's point of view, memory is split into equally sized blocks
+called *pages*. These are generally 4KiB.
+
+Pages are organized in virtually contiguous ranges called VMA
+(Virtual Memory Area).
+
+VMAs are created when a process requests a new pool of memory pages through
+the [mmap() system call](https://man7.org/linux/man-pages/man2/mmap.2.html).
+Applications rarely call mmap() directly. Those calls are typically mediated by
+the allocator, `malloc()/operator new()` for native processes or by the
+Android RunTime for Java apps.
+
+VMAs can be of two types: file-backed and anonymous.
+
+**File-backed VMAs** are a view of a file in memory. They are obtained passing a
+file descriptor to `mmap()`. The kernel will serve page faults on the VMA
+through the passed file, so reading a pointer to the VMA becomes the equivalent
+of a `read()` on the file.
+File-backed VMAs are used, for instance, by the dynamic linker (`ld`) when
+executing new processes or dynamically loading libraries, or by the Android
+framework, when loading a new .dex library or accessing resources in the APK.
+
+**Anonymous VMAs** are memory-only areas not backed by any file. This is the way
+allocators request dynamic memory from the kernel. Anonymous VMAs are obtained
+calling `mmap(... MAP_ANONYMOUS ...)`.
+
+Physical memory is only allocated, in page granularity, once the application
+tries to read/write from a VMA. If you allocate 32 MiB worth of pages but only
+touch one byte, your process' memory usage will only go up by 4KiB. You will
+have increased your process' *virtual memory* by 32 MiB, but its resident
+*physical memory* by 4 KiB.
+
+When optimizing memory use of programs, we are interested in reducing their
+footprint in *physical memory*. High *virtual memory* use is generally not a
+cause for concern on modern platforms (except if you run out of address space,
+which is very hard on 64 bit systems).
+
+We call the amount a process' memory that is resident in *physical memory* its
+**RSS** (Resident Set Size). Not all resident memory is equal though.
+
+From a memory-consumption viewpoint, individual pages within a VMA can have the
+following states:
+
+* **Resident**: the page is mapped to a physical memory page. Resident pages can
+ be in two states:
+ * **Clean** (only for file-backed pages): the contents of the page are the
+ same of the contents on-disk. The kernel can evict clean pages more easily
+ in case of memory pressure. This is because if they should be needed
+ again, the kernel knows it can re-create its contents by reading them from
+ the underlying file.
+ * **Dirty**: the contents of the page diverge from the disk, or (in most
+ cases), the page has no disk backing (i.e. it's _anonymous_). Dirty pages
+ cannot be evicted because doing so would cause data loss. However they can
+ be swapped out on disk or ZRAM, if present.
+* **Swapped**: a dirty page can be written to the swap file on disk (on most Linux
+ desktop distributions) or compressed (on Android and CrOS through
+ [ZRAM](https://source.android.com/devices/tech/perf/low-ram#zram)). The page
+ will stay swapped until a new page fault on its virtual address happens, at
+ which point the kernel will bring it back in main memory.
+* **Not present**: no page fault ever happened on the page or the page was
+ clean and later was evicted.
+
+It is generally more important to reduce the amount of _dirty_ memory as that
+cannot be reclaimed like _clean_ memory and, on Android, even if swapped in
+ZRAM, will still eat part of the system memory budget.
+This is why we looked at *Private Dirty* in the `dumpsys meminfo` example.
+
+*Shared* memory can be mapped into more than one process. This means VMAs in
+different processes refer to the same physical memory. This typically happens
+with file-backed memory of commonly used libraries (e.g., libc.so,
+framework.dex) or, more rarely, when a process `fork()`s and a child process
+inherits dirty memory from its parent.
+
+This introduces the concept of **PSS** (Proportional Set Size). In **PSS**,
+memory that is resident in multiple processes is proportionally attributed to
+each of them. If we map one 4KiB page into four processes, each of their
+**PSS** will increase by 1KiB.
+
+#### Recap
+
+* Dynamically allocated memory, whether allocated through C's `malloc()`, C++'s
+ `operator new()` or Java's `new X()` starts always as _anonymous_ and _dirty_,
+ unless it is never used.
+* If this memory is not read/written for a while, or in case of memory pressure,
+ it gets swapped out on ZRAM and becomes _swapped_.
+* Anonymous memory, whether _resident_ (and hence _dirty_) or _swapped_ is
+ always a resource hog and should be avoided if unnecessary.
+* File-mapped memory comes from code (java or native), libraries and resource
+ and is almost always _clean_. Clean memory also erodes the system memory
+ budget but typically application developers have less control on it.
+
+## Memory over time
+
+`dumpsys meminfo` is good to get a snapshot of the current memory usage, but
+even very short memory spikes can lead to low-memory situations, which will
+lead to [LMKs](#lmk). We have two tools to investigate situations like this
+
+* RSS High Watermark.
+* Memory tracepoints.
+
+### RSS High Watermark
+
+We can get a lot of information from the `/proc/[pid]/status` file, including
+memory information. `RssHWM` shows the maximum RSS usage the process has seen
+since it was started. This value is kept updated by the kernel.
+
+```bash
+$ adb shell cat '/proc/$(pidof com.android.systemui)/status'
+[...]
+VmHWM: 256972 kB
+VmRSS: 195272 kB
+RssAnon: 30184 kB
+RssFile: 164420 kB
+RssShmem: 668 kB
+VmSwap: 43960 kB
+[...]
+```
+
+### Memory tracepoints
+
+NOTE: For detailed instructions about the memory trace points see the
+ [Data sources > Memory > Counters and events](
+ /docs/data-sources/memory-counters.md) page.
+
+We can use Perfetto to get information about memory management events from the
+kernel.
+
+```bash
+$ adb shell perfetto \
+ -c - --txt \
+ -o /data/misc/perfetto-traces/trace \
+<<EOF
+
+buffers: {
+ size_kb: 8960
+ fill_policy: DISCARD
+}
+buffers: {
+ size_kb: 1280
+ fill_policy: DISCARD
+}
+data_sources: {
+ config {
+ name: "linux.process_stats"
+ target_buffer: 1
+ process_stats_config {
+ scan_all_processes_on_start: true
+ }
+ }
+}
+data_sources: {
+ config {
+ name: "linux.ftrace"
+ ftrace_config {
+ ftrace_events: "mm_event/mm_event_record"
+ ftrace_events: "kmem/rss_stat"
+ ftrace_events: "kmem/ion_heap_grow"
+ ftrace_events: "kmem/ion_heap_shrink"
+ }
+ }
+}
+duration_ms: 30000
+
+EOF
+```
+
+While it is running, take a photo if you are following along.
+
+Pull the file using `adb pull /data/misc/perfetto-traces/trace ~/mem-trace`
+and upload to the [Perfetto UI](https://ui.perfetto.dev). This will show
+overall stats about system [ION](#ion) usage, and per-process stats to
+expand. Scroll down (or Ctrl-F for) to `com.google.android.GoogleCamera` and
+expand. This will show a timeline for various memory stats for camera.
+
+
+
+We can see that around 2/3 into the trace, the memory spiked (in the
+mem.rss.anon track). This is where I took a photo. This is a good way to see
+how the memory usage of an application reacts to different triggers.
+
+## Which tool to use
+
+If you want to drill down into _anonymous_ memory allocated by Java code,
+labeled by `dumpsys meminfo` as `Dalvik Heap`, see the
+[Analyzing the java heap](#java-hprof) section.
+
+If you want to drill down into _anonymous_ memory allocated by native code,
+labeled by `dumpsys meminfo` as `Native Heap`, see the
+[Analyzing the Native Heap](#heapprofd) section. Note that it's frequent to end
+up with native memory even if your app doesn't have any C/C++ code. This is
+because the implementation of some framework API (e.g. Regex) is internally
+implemented through native code.
+
+If you want to drill down into file-mapped memory the best option is to use
+`adb shell showmap PID` (on Android) or inspect `/proc/PID/smaps`.
+
+
+## {#lmk} Low-memory kills
+
+When an Android device becomes low on memory, a daemon called `lmkd` will
+start killing processes in order to free up memory. Devices' strategies differ,
+but in general processes will be killed in order of descending `oom_score_adj`
+score (i.e. background apps and processes first, foreground processes last).
+
+Apps on Android are not killed when switching away from them. They instead
+remain *cached* even after the user finishes using them. This is to make
+subsequent starts of the app faster. Such apps will generally be killed
+first (because they have a higher `oom_score_adj`).
+
+We can collect information about LMKs and `oom_score_adj` using Perfetto.
+
+```protobuf
+$ adb shell perfetto \
+ -c - --txt \
+ -o /data/misc/perfetto-traces/trace \
+<<EOF
+
+buffers: {
+ size_kb: 8960
+ fill_policy: DISCARD
+}
+buffers: {
+ size_kb: 1280
+ fill_policy: DISCARD
+}
+data_sources: {
+ config {
+ name: "linux.process_stats"
+ target_buffer: 1
+ process_stats_config {
+ scan_all_processes_on_start: true
+ }
+ }
+}
+data_sources: {
+ config {
+ name: "linux.ftrace"
+ ftrace_config {
+ ftrace_events: "lowmemorykiller/lowmemory_kill"
+ ftrace_events: "oom/oom_score_adj_update"
+ ftrace_events: "ftrace/print"
+ atrace_apps: "lmkd"
+ }
+ }
+}
+duration_ms: 60000
+
+EOF
+```
+
+Pull the file using `adb pull /data/misc/perfetto-traces/trace ~/oom-trace`
+and upload to the [Perfetto UI](https://ui.perfetto.dev).
+
+
+
+We can see that the OOM score of Camera gets reduced (making it less likely
+to be killed) when it is opened, and gets increased again once it is closed.
+
+## {#heapprofd} Analyzing the Native Heap
+
+**Native Heap Profiles require Android 10.**
+
+NOTE: For detailed instructions about the native heap profiler and
+ troubleshooting see the [Data sources > Native heap profiler](
+ /docs/data-sources/native-heap-profiler.md) page.
+
+Applications usually get memory through `malloc` or C++'s `new` rather than
+directly getting it from the kernel. The allocator makes sure that your memory
+is more efficiently handled (i.e. there are not many gaps) and that the
+overhead from asking the kernel remains low.
+
+We can log the native allocations and frees that a process does using
+*heapprofd*. The resulting profile can be used to attribute memory usage
+to particular function callstacks, supporting a mix of both native and Java
+code. The profile *will only show allocations done while it was running*, any
+allocations done before will not be shown.
+
+### Capturing the profile
+
+Use the `tools/heap_profile` script to profile a process. If you are having
+trouble make sure you are using the [latest version](
+https://raw.githubusercontent.com/google/perfetto/master/tools/heap_profile).
+See all the arguments using `tools/heap_profile -h`, or use the defaults
+and just profile a process (e.g. `system_server`):
+
+```bash
+$ tools/heap_profile -n system_server
+
+Profiling active. Press Ctrl+C to terminate.
+You may disconnect your device.
+
+Wrote profiles to /tmp/profile-1283e247-2170-4f92-8181-683763e17445 (symlink /tmp/heap_profile-latest)
+These can be viewed using pprof. Googlers: head to pprof/ and upload them.
+```
+
+When you see *Profiling active*, play around with the phone a bit. When you
+are done, press Ctrl-C to end the profile. For this tutorial, I opened a
+couple of apps.
+
+### Viewing the data
+
+Then upload the `raw-trace` file from the output directory to the
+[Perfetto UI](https://ui.perfetto.dev) and click on diamond marker that
+shows.
+
+
+
+The tabs that are available are
+
+* **space**: how many bytes were allocated but not freed at this callstack the
+ moment the dump was created.
+* **alloc\_space**: how many bytes were allocated (including ones freed at the
+ moment of the dump) at this callstack
+* **objects**: how many allocations without matching frees were sampled at this
+ callstack.
+* **alloc\_objects**: how many allocations (including ones with matching frees)
+ were sampled at this callstack.
+
+The default view will show you all allocations that were done while the
+profile was running but that weren't freed (the **space** tab).
+
+
+
+We can see that a lot of memory gets allocated in paths through
+`ResourceManager.loadApkAssets`. To get the total memory that was allocated
+this way, we can enter "loadApkAssets" into the Focus textbox. This will only
+show callstacks where some frame matches "loadApkAssets".
+
+
+
+From this we have a clear idea where in the code we have to look. From the
+code we can see how that memory is being used and if we actually need all of
+it. In this case the key is the `_CompressedAsset` that requires decompressing
+into RAM rather than being able to (_cleanly_) memory-map. By not compressing
+these data, we can save RAM.
+
+## {#java-hprof} Analyzing the Java Heap
+
+**Java Heap Dumps require Android 11.**
+
+NOTE: For detailed instructions about the Java heap profiler and
+ troubleshooting see the [Data sources > Java heap profiler](
+ /docs/data-sources/java-heap-profiler.md) page.
+
+### Capturing the profile
+We can get a snapshot of the graph of all the Java objects that constitute the
+Java heap. We use the `tools/java_heap_dump` script. If you are having trouble
+make sure you are using the [latest version](
+https://raw.githubusercontent.com/google/perfetto/master/tools/java_heap_dump).
+
+```bash
+$ tools/java_heap_dump -n com.android.systemui
+
+Dumping Java Heap.
+Wrote profile to /tmp/tmpup3QrQprofile
+This can be viewed using https://ui.perfetto.dev.
+```
+
+### Viewing the Data
+
+Upload the trace to the [Perfetto UI](https://ui.perfetto.dev) and click on
+diamond marker that shows.
+
+
+
+This will present a flamegraph of the memory attributed to the shortest path
+to a garbage-collection root. In general an object is reachable by many paths,
+we only show the shortest as that reduces the complexity of the data displayed
+and is generally the highest-signal. The rightmost `[merged]` stacks is the
+sum of all objects that are too small to be displayed.
+
+
+
+The tabs that are available are
+
+* **space**: how many bytes are retained via this path to the GC root.
+* **objects**: how many objects are retained via this path to the GC root.
+
+If we want to only see callstacks that have a frame that contains some string,
+we can use the Focus feature. If we want to know all allocations that have to
+do with notifications, we can put "notification" in the Focus box.
+
+As with native heap profiles, if we want to focus on some specific aspect of the
+graph, we can filter by the names of the classes. If we wanted to see everything
+that could be caused by notifications, we can put "notification" in the Focus box.
+
+
+
+We aggregate the paths per class name, so if there are multiple objects of the
+same type retained by a `java.lang.Object[]`, we will show one element as its
+child, as you can see in the leftmost stack above.
diff --git a/docs/concepts/buffers.md b/docs/concepts/buffers.md
new file mode 100644
index 0000000..24bffbb
--- /dev/null
+++ b/docs/concepts/buffers.md
@@ -0,0 +1,421 @@
+# Buffers and dataflow
+
+This page describes the dataflow in Perfetto when recording traces. It describes
+all the buffering stages, explains how to size the buffers and how to debug
+data losses.
+
+## Concepts
+
+Tracing in Perfetto is an asynchronous multiple-writer single-reader pipeline.
+In many senses, its architecture is very similar to modern GPUs' command
+buffers.
+
+The design principles of the tracing dataflow are:
+
+* The tracing fastpath is based on direct writes into a shared memory buffer.
+* Highly optimized for low-overhead writing. NOT optimized for low-latency
+ reading.
+* Trace data is eventually committed in the central trace buffer by the end
+ of the trace or when explicit flush requests are issued via the IPC channel.
+* Producers are untrusted and should not be able to see each-other's trace data,
+ as that would leak sensitive information.
+
+In the general case, there are two types buffers involved in a trace. When
+pulling data from the Linux kernel's ftrace infrastructure, there is a third
+stage of buffering (one per-CPU) involved:
+
+
+
+#### Tracing service's central buffers
+
+These buffers (yellow, in the picture above) are defined by the user in the
+`buffers` section of the [trace config](config.md). In the most simple cases,
+one tracing session = one buffer, regardless of the number of data sources and
+producers.
+
+This is the place where the tracing data is ultimately kept, while in memory,
+whether it comes from the kernel ftrace infrastructure, from some other data
+source in `traced_probes` or from another userspace process using the
+[Perfetto SDK](/docs/instrumentation/tracing-sdk.md).
+At the end of the trace (or during, if in [streaming mode]) these buffers are
+written into the output trace file.
+
+These buffers can contain a mixture of trace packets coming from different data
+sources and even different producer processes. What-goes-where is defined in the
+[buffers mapping section](config.md#dynamic-buffer-mapping) of the trace config.
+Because of this, the tracing buffers are not shared across processes, to avoid
+cross-talking and information leaking across producer processes.
+
+#### Shared memory buffers
+
+Each producer process has one memory buffer shared 1:1 with the tracing service
+(blue, in the picture above), regardless of the number of data sources it hosts.
+This buffer is a temporary staging buffer and has two purposes:
+
+1. Zero-copy on the writer path. This buffer allows direct serialization of the
+ tracing data from the writer fastpath in a memory region directly readable by
+ the tracing service.
+
+2. Decoupling writes from reads of the tracing service. The tracing service has
+ the job of moving trace packets from the shared memory buffer (blue) into the
+ central buffer (yellow) as fast as it can.
+ The shared memory buffer hides the scheduling and response latencies of the
+ tracing service, allowing the producer to keep writing without losing data
+ when the tracing service is temporarily blocked.
+
+#### Ftrace buffer
+
+When the `linux.ftrace` data source is enabled, the kernel will have its own
+per-CPU buffers. These are unavoidable because the kernel cannot write directly
+into user-space buffers. The `traced_probes` process will periodically read
+those buffers, convert the data into binary protos and follow the same dataflow
+of userspace tracing. These buffers need to be just large enough to hold data
+between two frace read cycles (`TraceConfig.FtraceConfig.drain_period_ms`).
+
+## Life of a trace packet
+
+Here is a summary to understand the dataflow of trace packets across buffers.
+Consider the case of a producer process hosting two data sources writing packets
+at a different rates, both targeting the same central buffer.
+
+1. When each data source starts writing, it will grab a free page of the shared
+ memory buffer and directly serialize proto-encoded tracing data onto it.
+
+2. When a page of the shared memory buffer is filled, the producer will send an
+ async IPC to the service, asking it to copy the shared memory page just
+ written. Then, the producer will grab the next free page in the shared memory
+ buffer and keep writing.
+
+3. When the service receives the IPC, it copies the shared memory page into
+ the central buffer and marks the shared memory buffer page as free again. Data
+ sources within the producer are able to reuse that page at this point.
+
+4. When the tracing session ends, the service sends a `Flush` request to all
+ data sources. In reaction to this, data sources will commit all outstanding
+ shared memory pages, even if not completely full. The services copies these
+ pages into the service's central buffer.
+
+
+
+## Buffer sizing
+
+#### Central buffer sizing
+
+The math for sizing the central buffer is quite straightforward: in the default
+case of tracing without `write_into_file` (when the trace file is written only
+at the end of the trace), the buffer will hold as much data as it has been
+written by the various data sources.
+
+The total length of the trace will be `(buffer size) / (aggregated write rate)`.
+If all producers write at a combined rate of 2 MB/s, a 16 MB buffer will hold
+~ 8 seconds of tracing data.
+
+The write rate is highly dependent on the data sources configured and by the
+activity of the system. 1-2 MB/s is a typical figure on Android traces with
+scheduler tracing, but can go up easily by 1+ orders of magnitude if chattier
+data sources are enabled (e.g., syscall or pagefault tracing).
+
+When using [streaming mode] the buffer needs to be able to hold enough data
+between two `file_write_period_ms` periods (default: 5s).
+For instance, if `file_write_period_ms = 5000` and the write data rate is 2 MB/s
+the central buffer needs to be at least 5 * 2 = 10 MB to avoid data losses.
+
+#### Shared memory buffer sizing
+
+The sizing of the shared memory buffer depends on:
+
+* The scheduling characteristics of the underlying system, i.e. for how long the
+ tracing service can be blocked on the scheduler queues. This is a function of
+ the kernel configuration and nice-ness level of the `traced` process.
+* The max write rate of all data sources within a producer process.
+
+Suppose that a producer produce at a max rate of 8 MB/s. If `traced` gets
+blocked for 10 ms, the shared memory buffer need to be at least 8 * 0.01 = 80 KB
+to avoid losses.
+
+Empirical measurements suggest that on most Android systems a shared memory
+buffer size of 128-512 KB is good enough.
+
+The default shared memory buffer size is 256 KB. When using the Perfetto Client
+Library, this value can be tweaked setting `TracingInitArgs.shmem_size_hint_kb`.
+
+WARNING: if a data source writes very large trace packets in a single batch,
+either the shared memory buffer needs to be big enough to handle that or
+`BufferExhaustedPolicy.kStall` must be employed.
+
+For instance, consider a data source that emits a 2MB screenshot every 10s.
+Its (simplified) code, would look like:
+```c++
+for (;;) {
+ ScreenshotDataSource::Trace([](ScreenshotDataSource::TraceContext ctx) {
+ auto packet = ctx.NewTracePacket();
+ packet.set_bitmap(Grab2MBScreenshot());
+ });
+ std::this_thread::sleep_for(std::chrono::seconds(10));
+}
+```
+
+Its average write rate is 2MB / 10s = 200 KB/s. However, the data source will
+create bursts of 2MB back-to-back without yielding; it is limited only by the
+tracing serialization overhead. In practice, it will write the 2MB buffer at
+O(GB/s). If the shared memory buffer is < 2 MB, the tracing service will be
+unlikely to catch up at that rate and data losses will be experienced.
+
+In a case like this these options are:
+
+* Increase the size of the shared memory buffer in the producer that hosts the
+ data source.
+* Split the write into chunks spaced by some delay.
+* Adopt the `BufferExhaustedPolicy::kStall` when defining the data source:
+
+```c++
+class ScreenshotDataSource : public perfetto::DataSource<ScreenshotDataSource> {
+ public:
+ constexpr static BufferExhaustedPolicy kBufferExhaustedPolicy =
+ BufferExhaustedPolicy::kStall;
+ ...
+};
+```
+
+## Debugging data losses
+
+#### Ftrace kernel buffer losses
+
+When using the Linux kernel ftrace data source, losses can occur in the
+kernel -> userspace path if the `traced_probes` process gets blocked for too
+long.
+
+At the trace proto level, losses in this path are recorded:
+* In the [`FtraceCpuStats`][FtraceCpuStats] messages, emitted both at the
+ beginning and end of the trace. If the `overrun` field is non-zero, data has
+ been lost.
+* In the [`FtraceEventBundle.lost_events`][FtraceEventBundle] field. This allows
+ to locate precisely the point where data loss happened.
+
+At the TraceProcessor SQL level, this data is available in the `stats` table:
+
+```sql
+> select * from stats where name like 'ftrace_cpu_overrun_end'
+name idx severity source value
+-------------------- -------------------- -------------------- ------ ------
+ftrace_cpu_overrun_e 0 data_loss trace 0
+ftrace_cpu_overrun_e 1 data_loss trace 0
+ftrace_cpu_overrun_e 2 data_loss trace 0
+ftrace_cpu_overrun_e 3 data_loss trace 0
+ftrace_cpu_overrun_e 4 data_loss trace 0
+ftrace_cpu_overrun_e 5 data_loss trace 0
+ftrace_cpu_overrun_e 6 data_loss trace 0
+ftrace_cpu_overrun_e 7 data_loss trace 0
+```
+
+These losses can be mitigated either increasing
+[`TraceConfig.FtraceConfig.buffer_size_kb`][FtraceConfig]
+ or decreasing
+[`TraceConfig.FtraceConfig.drain_period_ms`][FtraceConfig]
+
+#### Shared memory losses
+
+Tracing data can be lost in the shared memory due to bursts while traced is
+blocked.
+
+At the trace proto level, losses in this path are recorded:
+
+* In [`TraceStats.BufferStats.trace_writer_packet_loss`][BufferStats].
+* In [`TracePacket.previous_packet_dropped`][TracePacket].
+ Caveat: the very first packet emitted by every data source is also marked as
+ `previous_packet_dropped=true`. This is because the service has no way to
+ tell if that was the truly first packet or everything else before that was
+ lost.
+
+At the TraceProcessor SQL level, this data is available in the `stats` table:
+```sql
+> select * from stats where name = 'traced_buf_trace_writer_packet_loss'
+name idx severity source value
+-------------------- -------------------- -------------------- --------- -----
+traced_buf_trace_wri 0 data_loss trace 0
+```
+
+#### Central buffer losses
+
+Data losses in the central buffer can happen for two different reasons:
+
+1. When using `fill_policy: RING_BUFFER`, older tracing data is overwritten by
+ virtue of wrapping in the ring buffer.
+ These losses are recorded, at the trace proto level, in
+ [`TraceStats.BufferStats.chunks_overwritten`][BufferStats].
+
+2. When using `fill_policy: DISCARD`, newer tracing data committed after the
+ buffer is full is dropped.
+ These losses are recorded, at the trace proto level, in
+ [`TraceStats.BufferStats.chunks_discarded`][BufferStats].
+
+At the TraceProcessor SQL level, this data is available in the `stats` table,
+one entry per central buffer:
+
+```sql
+> select * from stats where name = 'traced_buf_chunks_overwritten' or name = 'traced_buf_chunks_discarded'
+name idx severity source value
+-------------------- -------------------- -------------------- ------- -----
+traced_buf_chunks_di 0 info trace 0
+traced_buf_chunks_ov 0 data_loss trace 0
+```
+
+Summary: the best way to detect and debug data losses is to use Trace Processor
+and issue the query:
+`select * from stats where severity = 'data_loss' and value != 0`
+
+## Atomicity and ordering guarantees
+
+A "writer sequence" is the sequence of trace packets emitted by a given
+TraceWriter from a data source. In almost all cases 1 data source ==
+1+ TraceWriter(s). Some data sources that support writing from multiple threads
+typically create one TraceWriter per thread.
+
+* Trace packets written from a sequence are emitted in the trace file in the
+ same order they have been written, without gaps.
+
+* There is no ordering guarantee between packets written by different sequences.
+ Sequences are, by design, concurrent and more than one linearization is
+ possible. The service does NOT respect global timestamp ordering across
+ different sequences. If two packets from two sequences were emitted in
+ global timestamp order, the service can still emit them in the trace file in
+ the opposite order.
+
+* Trace packets are atomic. If a trace packet is emitted in the trace file, it
+ is guaranteed to be contain all the fields that the data source wrote. If a
+ trace packet is large and spans across several shared memory buffer pages, the
+ service will save it in the trace file only if it can observe that all
+ fragments have been committed without gaps.
+
+* If a trace packet is lost (e.g. because of wrapping in the ring buffer
+ or losses in the shared memory buffer), no further trace packet will be
+ emitted for that sequence, until all packets before are dropped as well.
+ In other words, if the tracing service ends up in a situation where it sees
+ packets 1,2,5,6 for a sequence, it will only emit 1, 2. If, however, new
+ packets (e.g., 7, 8, 9) are written and they overwrite 1, 2, clearing the gap,
+ the full sequence 5, 6, 7, 8, 9 will be emitted.
+ This behavior, however, doesn't hold when using [streaming mode] because,
+ in that case, the periodic read will consume the packets in the buffer and
+ clear the gaps, allowing the sequence to restart.
+
+## Incremental state in trace packets
+
+In many cases trace packets are fully independent of each other and can be
+processed and interpreted without further context.
+In some cases, however, trace packets can be behaves more like inter-frame video
+encoding techniques, where some frames require the keyframe to be present to be
+meaningfully decoded.
+
+Here are are two concrete examples:
+
+1. Ftrace scheduling slices and /proc/pid scans. ftrace scheduling events are
+ keyed by thread id. In most cases users want to map those events back to the
+ parent process (the thread-group). To solve this, when both the
+ `linux.ftrace` and the `linux.process_stats` data sources are enabled in a
+ Perfetto trace, the latter does capture process<>thread associations from
+ the /proc pseudo-filesystem, whenever a new thread-id is seen by ftrace.
+ A typical trace in this case looks as follows:
+ ```
+ # From process_stats's /proc scanner.
+ pid: 610; ppid: 1; cmdline: "/system/bin/surfaceflinger"
+
+ # From ftrace
+ timestamp: 95054961131912; sched_wakeup: pid: 610; target_cpu: 2;
+ timestamp: 95054977528943; sched_switch: prev_pid: 610 prev_prio: 98
+ ```
+ The /proc entry is emitted only once per process to avoid bloating the size of
+ the trace. In lack of data losses this is fine to be able to reconstruct all
+ scheduling events for that pid. If, however, the process_stats packet gets
+ dropped in the ring buffer, there will be no way left to work out the process
+ details for all the other ftrace events that refer to that PID.
+
+2. The Perfetto Client Libraries, makes extensive use of string interning. Most
+ strings and descriptors (e.g. details about processes / threads) are emitted
+ only once and later referred to using a monotonic ID. In case a loss of the
+ descriptor packet, it is not possible to make fully sense of those events.
+
+Trace Processor has built-in mechanism that detect loss of interning data and
+skips ingesting packets that refer to missing interned strings or descriptors.
+
+When using tracing in ring-buffer mode, these types of losses are very likely to
+happen.
+
+There are two mitigations for this:
+
+1. Issuing periodic invalidations of the incremental state via
+ [`TraceConfig.IncrementalStateConfig.clear_period_ms`][IncrStateConfig].
+ This will cause the data sources that make use of incremental state to
+ periodically drop the interning / process mapping tables and re-emit the
+ descriptors / strings on the next occurence. This mitigates quite well the
+ problem in the context of ring-buffer traces, as long as the
+ `clear_period_ms` is one order of magnitude lower than the estimated length
+ of trace data in the central trace buffer.
+
+2. Recording the incremental state into a dedicated buffer (via
+ `DataSourceConfig.target_buffer`). This technique is quite commonly used with
+ in the ftrace + process_stats example mentioned before, recording the
+ process_stats packet in a dedicated buffer less likely to wrap (ftrace events
+ are much more frequent than descriptors for new processes).
+
+## Flushes and windowed trace importing
+
+Another common problem experienced in traces that involve multiple data sources
+is the non-synchronous nature of trace commits. As explained in the
+[Life of a trace packet](#life-of-a-trace-packet) section above, trace data is
+commited only when a full memory page of the shared memory buffer is filled (or
+at when the tracing session ends). In most cases, if data sources produce events
+at a regular cadence, pages are filled quite quickly and events are committed
+in the central buffers within seconds.
+
+In some other cases, however, a data source can emit events only sporadically.
+Imagine the case of a data source that emits events when the display is turned
+on/off. Such an infequent event might end up being staged in the shared memory
+buffer for very long times and can end up being commited in the trace buffer
+hours after it happened.
+
+Another scenario where this can happen is when using ftrace and when a
+particular CPU is idle most of the time or gets hot-unplugged (ftrace uses
+per-cpu buffers). In this case a CPU might record little-or-no data for several
+minutes while the other CPUs pump thousands of new trace events per second.
+
+This causes two side effects that end up breaking user expectations or causing
+bugs:
+
+* The UI can show an abnormally long timeline with a huge gap in the middle.
+ The packet ordering of events doesn't matter for the UI because events are
+ sorted by timestamp at import time. The trace in this case will contain very
+ recent events plus a handful of stale events that happened hours before. The
+ UI, for correctness, will try to display all events, showing a handful of
+ early events, followed by a huge temporal gap when nothing happened,
+ followed by the stream of recent events.
+
+* When recording long traces, Trace Processor can show import errors of the form
+ "XXX event out-of-order". This is because. in order to limit the memory usage
+ at import time, Trace Processor sorts events using a sliding window. If trace
+ packets are too out-of-order (trace file order vs timestamp order), the
+ sorting will fail and some packets will be dropped.
+
+#### Mitigations
+
+The best mitigation for these sort of problems is to specify a
+[`flush_period_ms`][TraceConfig] in the trace config (10-30 seconds is usually
+good enough for most cases), especially when recording long traces.
+
+This will cause the tracing service to issue periodic flush requests to data
+sources. A flush requests causes the data source to commit the shared memory
+buffer pages into the central buffer, even if they are not completely full.
+By default, a flush issued only at the end of the trace.
+
+In case of long traces recorded without `flush_period_ms`, another option is to
+pass the `--full-sort` option to `trace_processor_shell` when importing the
+trace. Doing so will disable the windowed sorting at the cost of a higher
+memory usage (the trace file will be fully buffered in memory before parsing).
+
+[streaming mode]: /docs/concepts/config#long-traces
+[TraceConfig]: /docs/reference/trace-config-proto.autogen#TraceConfig
+[FtraceConfig]: /docs/reference/trace-config-proto.autogen#FtraceConfig
+[IncrStateConfig]: /docs/reference/trace-config-proto.autogen#FtraceConfig.IncrementalStateConfig
+[FtraceCpuStats]: /docs/reference/trace-packet-proto.autogen#FtraceCpuStats
+[FtraceEventBundle]: /docs/reference/trace-packet-proto.autogen#FtraceEventBundle
+[TracePacket]: /docs/reference/trace-packet-proto.autogen#TracePacket
+[BufferStats]: /docs/reference/trace-packet-proto.autogen#TraceStats.BufferStats
\ No newline at end of file
diff --git a/docs/clock-sync.md b/docs/concepts/clock-sync.md
similarity index 93%
rename from docs/clock-sync.md
rename to docs/concepts/clock-sync.md
index 7ce7894..95a200f 100644
--- a/docs/clock-sync.md
+++ b/docs/concepts/clock-sync.md
@@ -1,17 +1,17 @@
 # Synchronization of multiple clock domains

-As per [6756fb05][6756fb05] Perfetto allows to deal with events using different
+As per [6756fb05][6756fb05] Perfetto handles events using different
 clock domains. On top of the default set of builtin clock domains, new clock
 domains can be dynamically created at trace-time.

 Clock domains are allowed to drift from each other.
-At import time, Perfetto's [Trace Processor](/docs/trace-processor.md) is able
+At import time, Perfetto's [Trace Processor](/docs/analysis/trace-processor.md) is able
 to rebuild the clock graph and use that to re-synchronize events on a global
-trace time, as long as [ClockSnapshot][clock_snapshot] packets are present in
+trace time, as long as the [ClockSnapshot][clock_snapshot] packets are present in
 the trace.

-Problem statement
------------------
+## Problem statement
+
 In a complex multi-producer scenario, different data source can emit events
 using different clock domains.

@@ -21,6 +21,7 @@
   but the Android event log uses `CLOCK_REALTIME`.
   Some other data sources can use `CLOCK_MONOTONIC`.
   These clocks can drift over time from each other due to suspend/resume.
+
 * Graphics-related events are typically timestamped by the GPU, which can use a
   hardware clock source that drifts from the system clock.

@@ -30,12 +31,14 @@
 To solve this, we allow events to be recorded with different clock domains and
 re-synchronize them at import time using clock snapshots.

-Trace proto syntax
-------------------
+## Trace proto syntax

 Clock synchronization is based on two elements of the trace:

-### 1. The [`timestamp_clock_id`][timestamp_clock_id] field of TracePacket
+1. [The timestamp_clock_id field of TracePacket](#timestamp_clock_id)
+2. [The ClockSnapshot trace packet](#clock_snapshot)
+
+### {#timestamp_clock_id} The timestamp_clock_id field of TracePacket

 ```protobuf
 message TracePacket {
@@ -64,8 +67,8 @@
 Builtin clocks cover the most common case of data sources using one of the
 POSIX clocks (see `man clock_gettime`). These clocks are periodically
 snapshotted by the `traced` service. The producer doesn't need to do anything
-else other than setting the `timestamp_clock_id` field in order to emit events
-that are use these clocks.
+other than set the `timestamp_clock_id` field in order to emit events
+that use these clocks.

 #### Sequence-scoped clocks
 Sequence-scoped clocks are application-defined clock domains that are valid only
@@ -77,7 +80,7 @@
 This covers the most common use case of a clock domain that is used only within
 a data source and not shared across different data sources.
 The main advantage of sequence-scoped clocks is that avoids the ID
-disambiguation problem and JustWorks™ for the most simple cases.
+disambiguation problem and JustWorks™ for the most simple case.

 In order to make use of a custom sequence-scoped clock domain a data source
 must:
@@ -120,13 +123,13 @@
 * Chose the clock ID as `(HASH("com.example.my_subsystem") + 128) & 0xFFFFFFF`
   where `HASH(x)` is the FNV-1a hash of the fully qualified clock domain name.

-### 2. The [`ClockSnapshot`][clock_snapshot] trace packet
+### {#clock_snapshot} The ClockSnapshot trace packet

 The [`ClockSnapshot`][clock_snapshot] packet defines sync points between two or
 more clock domains. It conveys the notion *"at this point in time, the timestamp
 of the clock domains X,Y,Z was 1000, 2000, 3000."*.

-The trace importer ([Trace Processor](/docs/trace-processor.md)) uses this
+The trace importer ([Trace Processor](/docs/analysis/trace-processor.md)) uses this
 information to establish a mapping between these clock domain. For instance,
 to realize that 1042 on clock domain X == 3042 on clock domain Z.

@@ -214,8 +217,8 @@
 CLOCK_BOOTTIME = (3703 - 1200) + 5200 = 7703
 ```

-Caveats
--------
+## Caveats
+
 Clock resolution between two domains (A,B) is allowed only as long as all the
 clock domains in the A -> B path are monotonic (or at least look so in the
 `ClockSnapshot` packets).
diff --git a/docs/concepts/config.md b/docs/concepts/config.md
new file mode 100644
index 0000000..1f8d37e
--- /dev/null
+++ b/docs/concepts/config.md
@@ -0,0 +1,477 @@
+# Trace configuration
+
+Unlike many always-on logging systems (e.g. Linux's rsyslog, Android's logcat),
+in Perfetto all tracing data sources are idle by default and record data only
+when instructed to do so.
+
+Data sources record data only when one (or more) tracing sessions are active.
+A tracing session is started by invoking the `perfetto` cmdline client and
+passing a config (see QuickStart guide for
+[Android](/docs/quickstart/android-tracing.md) or
+[Linux](/docs/quickstart/linux-tracing.md)).
+
+A simple trace config looks like this:
+
+```protobuf
+duration_ms: 10000
+
+buffers {
+ size_kb: 65536
+ fill_policy: RING_BUFFER
+}
+
+data_sources {
+ config {
+ name: "linux.ftrace"
+ target_buffer: 0
+ ftrace_config {
+ ftrace_events: "sched_switch"
+ ftrace_events: "sched_wakeup"
+ }
+ }
+}
+
+````
+
+And is used as follows:
+
+```bash
+perfetto --txt -c config.pbtx -o trace_file.pftrace
+```
+
+TIP: Some more complete examples of trace configs can be found in the repo in
+[`/test/configs/`](/test/configs/).
+
+## TraceConfig
+
+The TraceConfig is a protobuf message
+([reference docs](/docs/reference/trace-config-proto.autogen)) that defines:
+
+1. The general behavior of the whole tracing system, e.g.:
+ * The max duration of the trace.
+ * The number of in-memory buffers and their size.
+ * The max size of the output trace file.
+
+2. Which data sources to enable and their configuration, e.g.:
+ * For the [kernel tracing data source](/docs/data-sources/cpu-scheduling.md)
+ , which ftrace events to enable.
+ * For the [heap profiler](/docs/data-sources/native-heap-profiler.md), the
+ target process name and sampling rate.
+
+ See the _data sources_ section of the docs for details on how to
+ configure the data sources bundled with Perfetto.
+
+3. The `{data source} x {buffer}` mappings: which buffer each data
+ source should write into (see [buffers section](#buffers) below).
+
+The tracing service (`traced`) acts as a configuration dispatcher: it receives
+a config from the `perfetto` cmdline client (or any other
+[Consumer](/docs/concepts/service-model.md#consumer)) and forwards parts of the
+config to the various [Producers](/docs/concepts/service-model.md#producer)
+connected.
+
+When a tracing session is started by a consumer, the tracing service will:
+
+* Read the outer section of the TraceConfig (e.g. `duration_ms`, `buffers`) and
+ use that to determine its own behavior.
+* Read the list of data sources in the `data_sources` section. For each data
+ source listed in the config, if a corresponding name (`"linux.ftrace"` in the
+ example below) was registered, the service will ask the producer process to
+ start that data source, passing it the raw bytes of the
+ [`DataSourceConfig` subsection][dss] verbatim to the data source (See
+ backward/forward compat section below).
+
+
+
+[dss]: /docs/reference/trace-config-proto.autogen#DataSourceConfig
+
+## Buffers
+
+The buffer sections define the number, size and policy of the in-memory buffers
+owned by the tracing service. It looks as follows:
+
+```protobuf
+// Buffer #0
+buffers {
+ size_kb: 4096
+ fill_policy: RING_BUFFER
+}
+
+// Buffer #1
+buffers {
+ size_kb: 8192
+ fill_policy: DISCARD
+}
+```
+
+Each buffer has a fill policy which is either:
+
+* RING_BUFFER (default): the buffer behaves like a ring buffer and writes when
+ full will wrap over and replace the oldest trace data in the buffer.
+
+* DISCARD: the buffer stops accepting data once full. Further write attempts are
+ dropped.
+
+WARNING: DISCARD can have unexpected side-effect with data sources that commit
+data at the end of the trace.
+
+A trace config must define at least one buffer to be valid. In the simplest case
+all data sources will write their trace data into the same buffer.
+
+ While this is
+fine for most basic cases, it can be problematic in cases where different data
+sources write at significantly different rates.
+
+For instance, imagine a trace config that enables both:
+
+1. The kernel scheduler tracer. On a typical Android phone this records
+ ~10000 events/second, writing ~1 MB/s of trace data into the buffer.
+
+2. Memory stat polling. This data source writes the contents of /proc/meminfo
+ into the trace buffer and is configured to poll every 5 seconds, writing
+ ~100 KB per poll interval.
+
+If both data sources are configured to write into the same buffer and such
+buffer is set to 4MB, most traces will contain only one memory snapshot. There
+are very good chances that most traces won't contain any memory snapshot at all,
+even if the 2nd data sources was working perfectly.
+This is because during the 5 s. polling interval, the scheduler data source can
+end up filling the whole buffer, pushing the memory snapshot data out of the
+buffer.
+
+## Dynamic buffer mapping
+
+Data-source <> buffer mappings are dynamic in Perfetto.
+In the simplest case a tracing session can define only one buffer. By default,
+all data sources will record data into that one buffer.
+
+In cases like the example above, it might be preferable separating these data
+sources into different buffers.
+This can be achieved with the `target_buffer` field of the TraceConfig.
+
+
+
+Can be achieved with:
+
+```protobuf
+data_sources {
+ config {
+ name: "linux.ftrace"
+ target_buffer: 0 // <-- This goes into buffer 0.
+ ftrace_config { ... }
+ }
+}
+
+data_sources: {
+ config {
+ name: "linux.sys_stats"
+ target_buffer: 1 // <-- This goes into buffer 1.
+ sys_stats_config { ... }
+ }
+}
+
+data_sources: {
+ config {
+ name: "android.heapprofd"
+ target_buffer: 1 // <-- This goes into buffer 1 as well.
+ heapprofd_config { ... }
+ }
+}
+```
+
+## PBTX vs binary format
+
+There are two ways to pass the trace config when using the `perfetto` cmdline
+client format:
+
+#### Text format
+
+It is the preferred format for human-driven workflows and exploration. It
+allows to pass directly the text file in the PBTX (ProtoBuf TeXtual
+representation) syntax, for the schema defined in the
+[trace_config.proto](/protos/perfetto/config/trace_config.proto)
+(see [reference docs](/docs/reference/trace-config-proto.autogen))
+
+When using this mode pass the `--txt` flag to `perfetto` to indicate the config
+should be interpreted as a PBTX file:
+
+```bash
+perfetto -c /path/to/config.pbtx --txt -o trace_file.pftrace
+```
+
+NOTE: The `--txt` option has been introduced only in Android 10 (Q). Older
+versions support only the binary format.
+
+WARNING: Do not use the text format for machine-to-machine interaction
+benchmark, scripts and tools) as it's more prone to breakages (e.g. if a field
+is renamed or an enum is turned into an integer)
+
+#### Binary format
+
+It is the preferred format for machine-to-machine (M2M) interaction. It involves
+passing the protobuf-encoded binary of the TraceConfig message.
+This can be obtained passing the PBTX in input to the protobuf's `protoc`
+compiler (which can be downloaded
+[here](https://github.com/protocolbuffers/protobuf/releases)).
+
+```bash
+cd ~/code/perfetto # external/perfetto in the Android tree.
+
+protoc --encode=perfetto.protos.TraceConfig \
+ -I. protos/perfetto/config/perfetto_config.proto \
+ < config.txpb \
+ > config.bin
+```
+
+and then passing it to perfetto as follows, without the `--txt` argument:
+
+```bash
+perfetto -c config.bin -o trace_file.pftrace
+```
+
+## {#long-traces} Streaming long traces
+
+By default Perfetto keeps the full trace buffer(s) in memory and writes it into
+the destination file (the `-o` cmdline argument) only at the end of the tracing
+session. This is to reduce the perf-intrusiveness of the tracing system.
+This, however, limits the max size of the trace to the physical memory size of
+the device, which is often too limiting.
+
+In some cases (e.g., benchmarks, hard to repro cases) it is desirable to capture
+traces that are way larger than that, at the cost of extra I/O overhead.
+
+To achieve that, Perfetto allows to periodically write the trace buffers into
+the target file (or stdout) using the following TraceConfig fields:
+
+* `write_into_file (bool)`:
+When true periodically drains the trace buffers into the output
+file. When this option is enabled, the userspace buffers need to be just
+big enough to hold tracing data between two write periods.
+The buffer sizing depends on the activity of the device.
+The data rate of a typical trace is ~1-4 MB/s. So a 16MB in-memory buffer can
+hold for up write periods of ~4 seconds before starting to lose data.
+
+* `file_write_period_ms (uint32)`:
+Overrides the default drain period (5s). Shorter periods require a smaller
+userspace buffer but increase the performance intrusiveness of tracing. If
+the period given is less than 100ms, the tracing service will use a period
+of 100ms.
+
+* `max_file_size_bytes (uint64)`:
+If set, stops the tracing session after N bytes have been written. Used to
+cap the size of the trace.
+
+For a complete example of a working trace config in long-tracing mode see
+[`/test/configs/long_trace.cfg`](/test/configs/long_trace.cfg).
+
+Summary: to capture a long trace just set `write_into_file:true`, set a long
+ `duration_ms` and use an in-memory buffer size of 32MB or more.
+
+## Data-source specific config
+
+Alongside the trace-wide configuration parameters, the trace config also defines
+data-source-specific behaviors. At the proto schema level, this is defined in
+the `DataSourceConfig` section of `TraceConfig`:
+
+From [data_source_config.proto](/protos/perfetto/config/data_source_config.proto):
+
+```protobuf
+message TraceConfig {
+ ...
+ repeated DataSource data_sources = 2; // See below.
+}
+
+message DataSource {
+ optional protos.DataSourceConfig config = 1; // See below.
+ ...
+}
+
+message DataSourceConfig {
+ optional string name = 1;
+ ...
+ optional FtraceConfig ftrace_config = 100 [lazy = true];
+ ...
+ optional AndroidPowerConfig android_power_config = 106 [lazy = true];
+}
+```
+
+Fields like `ftrace_config`, `android_power_config` are examples of data-source
+specific configs. The tracing service will completely ignore the contents of
+those fields and route the whole DataSourceConfig object to any data source
+registered with the same name.
+
+The `[lazy=true]` marker has a special implication in the
+[protozero](/docs/design-docs/protozero.md) code generator. Unlike standard
+nested messages, it generates raw accessors (e.g.,
+`const std::string& ftrace_config_raw()` instead of
+`const protos::FtraceConfig& ftrace_config()`). This is to avoid injecting too
+many `#include` dependencies and avoiding binary size bloat in the code that
+implements data sources.
+
+#### A note on backwards/forward compatibility
+The tracing service will route the raw binary blob of the `DataSourceConfig`
+message to the data sources with a matching name, without attempting to decode
+and re-encode it. If the `DataSourceConfig` section of the trace config contains
+a new field that didn't exist at the time when the service was built, the
+service will still pass the `DataSourceConfig` through to the data source.
+This allows to introduced new data sources without needing the service to
+know anything about them upfront.
+
+TODO: we are aware of the fact that today extending the `DataSourceConfig` with
+a custom proto requires changing the `data_source_config.proto` in the Perfetto
+repo, which is unideal for external projects. The long-term plan is to reserve
+a range of fields for non-upstream extensions and provide generic templated
+accessors for client code. Until then, we accept patches upstream to introduce
+ad-hoc configurations for your own data sources.
+
+## Multi-process data sources
+
+Some data sources are singletons. E.g., in the case of scheduler tracing that
+Perfetto ships on Android, there is only data source for the whole system,
+owned by the `traced_probes` service.
+
+However, in the general case multiple processes can advertise the same data
+source. This is the case, for instance, when using the
+[Perfetto SDK](/docs/instrumentation/tracing-sdk.md) for userspace
+instrumentation.
+
+If this happens, when starting a tracing session that specifies that data
+source in the trace config, Perfetto by default will ask all processes that
+advertise that data source to start it.
+
+In some cases it might be desirable to further limit the enabling of the data
+source to a specific process (or set of processes). That is possible through the
+`producer_name_filter` and `producer_name_regex_filter`.
+
+NOTE: the typical Perfetto run-time model is: one process == one Perfetto
+ Producer; one Producer typically hosts multiple data sources.
+
+When those filters are set, the Perfetto tracing service will activate the data
+source only in the subset of producers matching the filter.
+
+Example:
+
+```protobuf
+buffers {
+ size_kb: 4096
+}
+
+data_sources {
+ config {
+ name: "track_event"
+
+ # Enable the data source only on Chrome and Chrome canary.
+ producer_name_filter: "com.android.chrome"
+ producer_name_filter: "com.google.chrome.canary"
+ }
+}
+```
+
+## Triggers
+
+In nominal conditions, a tracing session has a lifecycle that simply matches the
+invocation of the `perfetto` cmdline client: trace data recording starts when
+the TraceConfig is passed to `perfetto` and ends when either the
+`TraceConfig.duration_ms` has elapsed, or when the cmdline client terminates.
+
+Perfetto supports an alternative mode of either starting or stopping the trace
+which is based on triggers. The overall idea is to declare in the trace config
+itself:
+
+* A set of triggers, which are just free-form strings.
+* Whether a given trigger should cause the trace to be started or stopped, and
+ the start/stop delay.
+
+Why using triggers? Why can't one just start perfetto or kill(SIGTERM) it when
+needed? The rationale of all this is the security model: in most Perfetto
+deployments (e.g., on Android) only privileged entities (e.g., adb shell) can
+configure/start/stop tracing. Apps are unprivileged in this sense and they
+cannot control tracing.
+
+Triggers offer a way to unprivileged apps to control, in a limited fashion, the
+lifecycle of a tracing session. The conceptual model is:
+
+* The privileged Consumer (see
+ [_Service model_](/docs/concepts/service-model.md)), i.e. the entity
+ that is normally authorized to start tracing (e.g., adb shell in Android),
+ declares upfront what are the possible trigger names for the trace and what
+ they will do.
+* Unprivileged entities (any random app process) can activate those triggers.
+ Unprivileged entities don't get a say on what the triggers will do, they only
+ communicate that an event happened.
+
+Triggers can be signaled via the cmdline util
+
+```bash
+/system/bin/trigger_perfetto "trigger_name"
+```
+
+(or also by starting an independent trace session which uses only the
+`activate_triggers: "trigger_name"` field in the config)
+
+There are two types of triggers:
+
+#### Start triggers
+
+Start triggers allow activating a tracing session only after some significant
+event has happened. Passing a trace config that has `START_TRACING` trigger
+causes the tracing session to stay idle (i.e. not recording any data) until either
+the trigger is hit or the `duration_ms` timeout is hit.
+
+Example config:
+```protobuf
+// If no trigger is hit, the trace will end without having recorded any data
+// after 30s.
+duration_ms: 30000
+
+// If the "myapp_is_slow" is hit, the trace starts recording data and will be
+// stopped after 5s.
+trigger_config {
+ trigger_mode: START_TRACING
+ triggers {
+ name: "myapp_is_slow"
+ stop_delay_ms: 5000
+ }
+}
+
+// The rest of the config is as usual.
+buffers { ... }
+data_sources { ... }
+```
+
+#### Stop triggers
+
+STOP_TRACING triggers allow to prematurely finalize a trace when the trigger is
+hit. In this mode the trace starts immediately when the `perfetto` client is
+invoked (like in nominal cases). The trigger acts as a premature finalization
+signal.
+
+This can be used to use perfetto in flight-recorder mode. By starting a trace
+with buffers configured in `RING_BUFFER` mode and `STOP_TRACING` triggers,
+the trace will be recorded in a loop and finalized when the culprit event is
+detected. This is key for events where the root cause is in the recent past
+(e.g., the app detects a slow scroll or a missing frame).
+
+Example config:
+```protobuf
+// If no trigger is hit, the trace will end after 30s.
+duration_ms: 30000
+
+// If the "missed_frame" is hit, the trace is stopped after 1s.
+trigger_config {
+ trigger_mode: STOP_TRACING
+ triggers {
+ name: "missed_frame"
+ stop_delay_ms: 1000
+ }
+}
+
+// The rest of the config is as usual.
+buffers { ... }
+data_sources { ... }
+```
+
+## Other resources
+
+* [TraceConfig Reference](/docs/reference/trace-config-proto.autogen)
+* [Buffers and dataflow](/docs/concepts/buffers.md)
diff --git a/docs/detached-mode.md b/docs/concepts/detached-mode.md
similarity index 80%
rename from docs/detached-mode.md
rename to docs/concepts/detached-mode.md
index 34d1e57..b75a5e3 100644
--- a/docs/detached-mode.md
+++ b/docs/concepts/detached-mode.md
@@ -3,34 +3,33 @@
 This document describes the `--detach` and `--attach` advanced operating modes
 of the `perfetto` cmdline client.

-The use of `--detach` and `--attach` is highly discouraged because of the risk
-of leaking tracing sessions and accidentally leaving tracing on for arbitrarily
-long periods of time.
+WARNING: The use of `--detach` and `--attach` is highly discouraged because of
+the risk of leaking tracing sessions and accidentally leaving tracing on for
+arbitrarily long periods of time.

-If what you are looking for is just a way to grab a trace in background (e.g.,
-while the USB cable / adb is disconnected) from the adb shell simply use
-`--background`.
+TIP: If what you are looking for is just a way to grab a trace in background
+(e.g., while the USB cable / adb is disconnected) from the adb shell simply
+use `--background`.

-Use case
---------
+## Use case
+
 By default the tracing service `traced` keeps the lifetime of a tracing session
 attached to the lifetime of the `perfetto` cmdline client that started it.
 This means that a `killall perfetto` or `kill $PID_OF_PERFETTO` is sufficient
 to guarantee that the tracing session is stopped.
-There are rare occasions when this is undesirable.

-The use case this has been designed for is the Traceur app (on-device tracing
-UI for Android).
+There are rare occasions when this is undesirable; for example, this mode of
+operation was designed for the Traceur app (on-device tracing UI for Android).
+
 When required by the user, Traceur needs to enable tracing in the background,
-possibly for very long periods of time.
-Because Traceur is not a persistent service (and even if it was, it could be
-still low-memory-killed), it cannot just use `--background`. This is
+possibly for very long periods of time. Because Traceur is not a persistent service (and even if it was, it could be
+still low-memory-killed), it cannot just use `--background`; this is
 because the Android framework kills any other process in the same process group
 when tearing down an app/service, and this would including killing forked
 `perfetto` client obtained via `--background`.

-Operation
----------
+## Operation
+
 `--detach=key` decouples the lifetime of the cmdline client from the lifetime
 of the tracing session.

@@ -38,11 +37,11 @@
 re-identify the session using `--attach=key`.

 Once detached, the cmdline client will exit (without forking any bg process) and
-the `traced` service will keep the tracing session alive.
-Because of the exit, a client that wants to use `--detach` needs to set the
-[`write_into_file`](long-traces.md) flag in the trace config, which transfers
-the output trace file descriptor to the service (see the [examples](#examples)
-section).
+the `traced` service will keep the tracing session alive. Because of the exit,
+a client that wants to use `--detach` needs to set the
+[`write_into_file`](config.md#long-traces) option in the trace config, which
+transfers the responsibility of writing the output trace file to the
+service (see the [examples](#examples) section).

 A detached session will run until either:

@@ -80,8 +79,7 @@
 - 1 in case of a general error (e.g. wrong cmdline, cannot reach the service).
 - 2 if no detached session with the given `key` is found.

-Examples
---------
+## Examples

 ### Capturing a long trace in detached mode
diff --git a/docs/concepts/service-model.md b/docs/concepts/service-model.md
new file mode 100644
index 0000000..7565545
--- /dev/null
+++ b/docs/concepts/service-model.md
@@ -0,0 +1,120 @@
+# Service-based model
+
+
+
+## Service
+
+The tracing service is a long-lived entity (a system daemon on Linux/Android,
+a service in Chrome) that has the following responsibilities:
+
+* Maintains a registry of active producers and their data sources.
+* Owns the trace buffers.
+* Handles multiplexing of several tracing sessions.
+* Routes the trace config from the consumers to the corresponding producers.
+* Tells the Producers when and what to trace.
+* Moves data from the Producer's shared memory buffer to the central non-shared
+ trace buffers.
+
+## Producer
+
+A producer is an untrusted entity that offers the ability to contribute to the
+trace. In a multiprocess model, a producer almost always corresponds to a client
+process of the tracing service. It advertises its ability to contribute to the trace with one or more data sources.
+Each producer has exactly:
+
+* One shared memory buffer, shared exclusively with the tracing service.
+* One IPC channel with the tracing service.
+
+A producer is completely decoupled (both technically and conceptually) from
+consumer(s). A producer knows nothing about:
+
+* How many consumer(s) are connected to the service.
+* How many tracing sessions are active.
+* How many other producer(s) are registered or active.
+* Trace data written by other producer(s).
+
+NOTE: In rare circumstances a process can host more than one producer and hence more
+than one shared memory buffer. This can be the case for a process bundling
+third-party libraries that in turn include the Perfetto client library.
+Concrete example: at some point in the future Chrome might expose one Producer for tracing within the main project, one for V8 and one for Skia (for each child
+process).
+
+## Consumer
+A consumer is a trusted entity (a cmdline client on Linux/Android, an interface
+of the Browser process in Chrome) that controls (non-exclusively) the tracing service and reads back (destructively) the trace buffers.
+A consumer has the ability to:
+* Send a [trace config](#) to the service, determining:
+ * How many trace buffers to create.
+ * How big the trace buffers should be.
+ * The policy for each buffer (*ring-buffer* or *stop-when-full*).
+ * Which data sources to enable.
+ * The configuration for each data source.
+ * The target buffer for the data produced by each data source configured.
+* Enable and disable tracing.
+* Read back the trace buffers:
+ * Streaming data over the IPC channel.
+ * Passing a file descriptor to the service and instructing it to periodically
+ save the trace buffers into the file.
+
+## Data source
+
+A data source is a capability, exposed by a Producer, of providing some tracing
+data. A data source almost always defines its own schema (a protobuf) consisting
+of:
+* At most one `DataSourceConfig` sub-message:
+
+ ([example](/protos/perfetto/config/ftrace/ftrace_config.proto))
+* One or more `TracePacket` sub-messages
+ ([example](/protos/perfetto/trace/ps/process_tree.proto))
+
+Different producers may expose the same data source. Concrete example:
+*** aside
+At some point in the near future we might offer, as part of Perfetto, a library
+for in-process heap profiling. In such case more than one producer, linking
+against the updated Perfetto library, will expose the heap profiler data source,
+for its own process.
+**
+
+## IPC channel
+In a multiprocess scenario, each producer and each consumer interact with the
+service using an IPC channel. IPC is used only in non-fast-path interactions,
+mostly handshakes such as enabling/disabling trace (consumer), (un)registering
+and starting/stopping data sources (producer). The IPC is typically NOT employed
+to transport the protobufs for the trace.
+Perfetto provides a POSIX-friendly IPC implementation, based on protobufs over a
+UNIX socket (see
+[Socket protocol](/docs/design-docs/api-and-abi#socket-protocol)).
+
+That IPC implementation is not mandated. Perfetto allows the embedder:
+
+* Wrap its own IPC subsystem (e.g., Perfetto in Chromium uses Mojo)
+* Not use an IPC mechanism at all and just short circuit the
+ Producer <> Service <> Consumer interaction via `PostTask(s)`.
+
+## Shared memory buffer
+Producer(s) write tracing data, in the form of protobuf-encoded binary blobs,
+directly into its shared memory buffer, using a special library called
+[ProtoZero](/docs/design-docs/protozero.md). The shared memory buffer:
+
+* Has a fixed and typically small size (configurable, default: 128 KB).
+* Is an ABI and must maintain backwards compatibility.
+* Is shared by all data sources of the producer.
+* Is independent of the number and the size of the trace buffers.
+* Is independent of the number of Consumer(s).
+* Is partitioned in *chunks* of variable size.
+
+Each chunk:
+
+* Is owned exclusively by one Producer thread (or shared through a mutex).
+* Contains a linear sequence of `TracePacket(s)`, or
+ fragments of that. A `TracePacket` can span across several chunks, the
+ fragmentation is not exposed to the consumers (consumers always see whole
+ packets as if they were never fragmented).
+* Can be owned and written by exactly one `TraceWriter`.
+* Is part of a reliable and ordered sequence, identified by the `WriterID`:
+ packets in a sequence are guaranteed to be read back in order, without gaps
+ and without repetitions.
+
+See the comments in
+[shared_memory_abi.h](/include/perfetto/ext/tracing/core/shared_memory_abi.h)
+for more details about the binary format of this buffer.
diff --git a/docs/contributing.md b/docs/contributing.md
deleted file mode 100644
index 9737028..0000000
--- a/docs/contributing.md
+++ /dev/null
@@ -1,52 +0,0 @@
-# Contributing to Perfetto
-This project uses [Android AOSP Gerrit][perfetto-gerrit] for code reviews,
-uses the [Google C++ style][google-cpp-style] and targets `-std=c++11`.
-
-Development happens in this repo:
-https://android.googlesource.com/platform/external/perfetto/
-
-## Contributor License Agreement
-
-Contributions to this project must be accompanied by a Contributor License
-Agreement. You (or your employer) retain the copyright to your contribution;
-this simply gives us permission to use and redistribute your contributions as
-part of the project. Head over to <https://cla.developers.google.com/> to see
-your current agreements on file or to sign a new one.
-
-You generally only need to submit a CLA once, so if you've already submitted one
-(even if it was for a different project), you probably don't need to do it
-again.
-
-## Code Reviews
-
-All submissions, including submissions by project members, require review.
-We use [Android AOSP Gerrit][perfetto-gerrit] for this purpose.
-
-`git cl upload` from [Chromium depot tools][depot-tools] is the preferred
-workflow to upload patches, as it supports presubmits and code formatting via
-`git cl format`.
-
-## Continuous integration
-
-Continuous build and test coverage is available at
-[ci.perfetto.dev](https://ci.perfetto.dev).
-
-**Trybots**:
-CLs uploaded to Gerrit are automatically submitted to the CI and
-and available on the CI page.
-If the label `Presubmit-Ready: +1` is set, the CI will also publish a comment
-like [this][ci-example] on the CL.
-
-## Community
-
-You can reach us on our [Discord channel](https://discord.gg/35ShE3A).
-If you prefer using IRC we have an experimental Discord <> IRC bridge
-synced with `#perfetto-dev` on [Freenode](https://webchat.freenode.net/).
-
-This project follows
-[Google's Open Source Community Guidelines](https://opensource.google/conduct/).
-
-[perfetto-gerrit]: https://android-review.googlesource.com/q/project:platform%252Fexternal%252Fperfetto+status:open
-[google-cpp-style]: https://google.github.io/styleguide/cppguide.html
-[depot-tools]: https://dev.chromium.org/developers/how-tos/depottools
-[ci-example]: https://android-review.googlesource.com/c/platform/external/perfetto/+/1108253/3#message-09fd27fb92ca8357abade3ec725919ac3445f3af
diff --git a/docs/build-instructions.md b/docs/contributing/build-instructions.md
similarity index 88%
rename from docs/build-instructions.md
rename to docs/contributing/build-instructions.md
index a68cb46..2bc82ae 100644
--- a/docs/build-instructions.md
+++ b/docs/contributing/build-instructions.md
@@ -1,6 +1,6 @@
 # Perfetto build instructions

-The source of truth for the Perfetto codebase currently lives in AOSP:
+The source of truth for the Perfetto codebase lives in AOSP:
 https://android.googlesource.com/platform/external/perfetto/

 Perfetto can be built both from the Android tree (AOSP) and standalone.
@@ -8,8 +8,8 @@
 Due to the reduced dependencies they are faster to iterate on and the
 suggested way to work on Perfetto.

-Get the code
-------------
+## Get the code
+
 **Standalone checkout**:
 ```
 $ git clone https://android.googlesource.com/platform/external/perfetto/
@@ -18,9 +18,8 @@
 **Android tree**:
 Perfetto lives in `external/perfetto` in the AOSP tree.

+## Prerequisites

-Prerequisites
--------------
 **Standalone checkout**:
 All dependent libraries are self-hosted and pulled through:
 ```
@@ -31,8 +30,8 @@
 See https://source.android.com/setup


-Building
---------
+## Building
+
 **Standalone checkout**:
 If you are a chromium developer and have depot_tools installed you can avoid
 the `tools/` prefix below and just use gn/ninja from depot_tools.
@@ -52,12 +51,6 @@
 $ tools/ninja -C out/android
 ```

-To build the UI (remember to run `tools/install-build-deps --ui` first):
-
-```
-$ tools/ninja -C out/android ui
-```
-
 **Android tree**:
 `$ mmma external/perfetto`
 or
@@ -67,8 +60,22 @@
 Executables and shared libraries are stripped by default by the Android build
 system. The unstripped artifacts are kept into `out/target/product/XXX/symbols`.

-IDE setup
----------
+## UI development
+
+To build the UI (remember to run `tools/install-build-deps --ui` first):
+
+```
+$ tools/ninja -C out/android ui
+
+```
+Test your changes on a local server using:
+
+```
+$ ui/run-dev-server out/android
+```
+Navigate to `localhost:10000` to see the changes.
+
+## IDE setup

 Use a following command in the checkout directory in order to generate the
 compilation database file:
@@ -81,21 +88,20 @@
 Visual Studio Code with C/C++ extension and any other tool and editor that
 supports the compilation database format.

-Build files
------------
+## Build files
+
 The source of truth of our build file is in the BUILD.gn files, which are based on [GN][gn-quickstart].
-The Android build file ([Android.bp](../Android.bp)) is autogenerated from the GN files
+The Android build file ([Android.bp](/Android.bp)) is autogenerated from the GN files
 through `tools/gen_android_bp`, which needs to be invoked whenever a change
 touches GN files or introduces new ones.
 A presubmit check checks that the Android.bp is consistent with GN files when
 submitting a CL through `git cl upload`.
 The generator has a whitelist of root targets that will be translated into the
 Android.bp file. If you are adding a new target, add a new entry to the
-`default_targets` variable inside [tools/gen_android_bp](../tools/gen_android_bp).
+`default_targets` variable inside [tools/gen\_android\_bp](/tools/gen_android_bp).

+## Supported platforms

-Supported platforms
--------------------
 **Linux desktop** (Debian Rodete):
   - Hermetic clang + libcxx toolchain (both following chromium's revisions)
   - GCC-7 and libstdc++ 6
@@ -107,14 +113,10 @@
 **Mac**:
  - XCode 9 / clang (currently maintained best-effort).

+## Build configurations

-
-Build configurations
---------------------
-*** aside
-`tools/build_all_configs.py` can be used to generate out/XXX folders for most of
+TIP: `tools/build_all_configs.py` can be used to generate out/XXX folders for most of
 the supported configurations.
-***

 The following [GN args][gn-quickstart] are supported:

@@ -143,7 +145,7 @@
 `cc_wrapper = "tool"`:
 Prepends all build commands with a wrapper command. Using `"ccache"` here
 enables the [ccache](https://github.com/ccache/ccache) caching compiler,
-which can considerable speed up repeat builds.
+which can considerably speed up repeat builds.

 `is_asan = true`:
 Enables [Address Sanitizer](https://github.com/google/sanitizers/wiki/AddressSanitizer)
diff --git a/docs/contributing/common-tasks.md b/docs/contributing/common-tasks.md
new file mode 100644
index 0000000..40c1910
--- /dev/null
+++ b/docs/contributing/common-tasks.md
@@ -0,0 +1,91 @@
+# Common tasks
+
+The checklists below show how to achieve some common tasks in the codebase.
+
+## Add a new ftrace event
+
+1. Find the `format` file for your event. The location of the file depends where `tracefs` is mounted but can often be found at `/sys/kernel/debug/tracing/events/EVENT_GROUP/EVENT_NAME/format`.
+2. Copy the format file into the codebase at `src/traced/probes/ftrace/test/data/synthetic/events/EVENT_GROUP/EVENT_NAME/format`.
+3. Add the event to [tools/ftrace_proto_gen/event_whitelist](/tools/ftrace_proto_gen/event_whitelist).
+4. Run `tools/run_ftrace_proto_gen`. This will update `protos/perfetto/trace/ftrace/ftrace_event.proto` and `protos/perfetto/trace/ftrace/GROUP_NAME.proto`.
+5. Run `tools/gen_all out/YOUR_BUILD_DIRECTORY`. This will update `src/traced/probes/ftrace/event_info.cc` and `protos/perfetto/trace/perfetto_trace.proto`.
+6. If special handling in `trace_processor` is desired update [src/trace_processor/importers/ftrace/ftrace_parser.cc](/src/trace_processor/importers/ftrace/ftrace_parser.cc) to parse the event.
+7. Upload and land your change as normal.
+
+Here is an [example change](https://android-review.googlesource.com/c/platform/external/perfetto/+/1290645) which added the `ion/ion_stat` event.
+
+## {#new-metric} Add a new trace-based metric
+
+1. Create the proto file containing the metric in the [protos/perfetto/metrics](/protos/perfetto/metrics) folder. The appropriate` BUILD.gn` file should be updated as well.
+2. Import the proto in [protos/perfetto/metrics/metrics.proto](/protos/perfetto/metrics/metrics.proto) and add a field for the new message.
+3. Run `tools/gen_all out/YOUR_BUILD_DIRECTORY`. This will update the generated headers containing the descriptors for the proto.
+  * *Note: this step has to be performed any time any metric-related proto is modified.*
+4. Add a new SQL file for the metric to [src/trace_processor/metrics](/src/trace_processor/metrics). The appropriate `BUILD.gn` file should be updated as well.
+  * To learn how to write new metrics, see the [trace-based metrics documentation](/docs/analysis/metrics.md).
+5. Build all targets in your out directory with `tools/ninja -C out/YOUR_BUILD_DIRECTORY`.
+6. Add a new diff test for the metric. This can be done by adding files to the [test/metrics](/test/metrics) folder and modifying the [index file](/test/metrics/index).
+7. Run the newly added test with `tools/diff_test_trace_processor.py <path to trace processor binary>`.
+8. Upload and land your change as normal.
+
+Here is an [example change](https://android-review.googlesource.com/c/platform/external/perfetto/+/1290643) which added the `time_in_state` metric.
+
+## Add a new trace processor table
+
+1. Create the new table in the appropriate header file in [src/trace_processor/tables](/src/trace_processor/tables) by copying one of the existing macro definitions.
+  * Make sure to understand whether a root or derived table is needed and copy the appropriate one. For more information see the [trace processor](/docs/analysis/trace-processor.md) documentation.
+2. Register the table with the trace processor in the constructor for the [TraceProcessorImpl class](/src/trace_processor/trace_processor_impl.cc).
+3. If also implementing ingestion of events into the table:
+  1. Modify the appropriate parser class in [src/trace_processor/importers](/src/trace_processor/importers) and add the code to add rows to the newly added table.
+  2. Add a new diff test for the added parsing code and table using `tools/add_tp_diff_test.sh`.
+    * Make sure to modify the [index file](/test/trace_processor/index) to correctly organize the test with other similar tests.
+  3. Run the newly added test with `tools/diff_test_trace_processor.py <path to trace processor binary>`.
+4. Upload and land your change as normal.
+
+## {#new-annotation} Add a new annotation
+
+NOTE: all currently implemented annotations are based only on the name of the slice. It is straightforward to extend this to also consider ancestors and other similar properties; we plan on doing this in the future.
+
+1. Change the [`DescribeSlice`](/src/trace_processor/analysis/describe_slice.h) function as appropriate.
+  * The inputs are the table containing all the slices from the trace and the id of the slice which an embedder (e.g. the UI) is requesting a description for.
+  * The output is a `SliceDescription` which is simply a `pair<description, doc link>`.
+2. Upload and land your change as normal.
+
+## Adding new derived events
+
+As derived events depend on metrics, the initial steps are same as that of developing a metric (see above).
+
+NOTE: the metric can be just an empty proto message during prototyping or if no summarization is necessary. However, generally if an event is important enough to display in the UI, it should also be tracked in benchmarks as a metric.
+
+To extend a metric with annotations:
+
+1. Create a new table or view with the name `<metric name>_annotations`.
+  * For example, for the [`android_startup`]() metric, we create a view named `android_startup_annotations`.
+  * Note that the trailing `_annotations` suffix in the table name is important.
+  * The schema required for this table is given below.
+
+2. Upload and land your change as normal.
+
+The schema of the `<metric name>_annotations` table/view is as follows:
+
+| Name         | Type     | Presence                              | Meaning                                                      |
+| :----------- | -------- | ------------------------------------- | ------------------------------------------------------------ |
+| `track_type` | `string` | Mandatory                             | 'slice' for slices, 'counter' for counters                   |
+| `track_name` | `string` | Mandatory                             | Name of the track to display in the UI. Also the track identifier i.e. all events with same `track_name` appear on the same track. |
+| `ts`         | `int64`  | Mandatory                             | The timestamp of the event (slice or counter)                |
+| `dur`        | `int64`  | Mandatory for slice, NULL for counter | The duration of the slice                                    |
+| `slice_name` | `string` | Mandatory for slice, NULL for counter | The name of the slice                                        |
+| `value`      | `double` | Mandatory for counter, NULL for slice | The value of the counter                                     |
+
+#### Known issues:
+
+* Nested slices within the same track are not supported. We plan to support this
+  once we have a concrete usecase.
+* Tracks are always created in the global scope. We plan to extend this to
+  threads and processes in the near future with additional contexts added as
+  necessary.
+* Instant events are currently not supported in the UI but this will be
+  implemented in the near future. In trace processor, instants are always `0`
+  duration slices with special rendering on the UI side.
+* There is no way to tie newly added events back to the source events in the
+  trace which were used to generate them. This is not currently a priority but
+  something we may add in the future.
diff --git a/docs/contributing/embedding.md b/docs/contributing/embedding.md
new file mode 100644
index 0000000..a43fbed
--- /dev/null
+++ b/docs/contributing/embedding.md
@@ -0,0 +1,78 @@
+# Embedding Perfetto
+
+## Trace Processor
+
+### Building
+
+As with all components in Perfetto, the trace processor can be built in several build systems:
+
+- GN (the native system)
+- Bazel
+- As part of the Android tree
+
+The trace processor is exposed as a static library `//:trace_processor` to Bazel and `src/trace_processor:trace_processor` in GN; it is not exposed to Android (but patches to add support for this are welcome).
+
+The trace processor is also built as a WASM target `src/trace_processor:trace_processor_wasm` for the Perfetto UI; patches for adding support for other supported build systems are welcome.
+
+The trace processor is also built as a shell binary, `trace_processor_shell` which backs the `trace_processor` tool described in other parts of the documentation. This is exposed as the `trace_processor_shell` target to Android, `//:trace_processor_shell` to Bazel and `src/trace_processor:trace_processor_shell` in GN.
+
+### Library structure
+
+The trace processor library is structured around the `TraceProcessor` class; all API methods exposed by trace processor are member functions on this class.
+
+The C++ header for this class is split between two files:  [include/perfetto/trace_processor/trace_processor_storage.h](/include/perfetto/trace_processor/trace_processor_storage.h) and [include/perfetto/trace_processor/trace_processor.h](/include/perfetto/trace_processor/trace_processor.h).
+
+### Reading traces
+
+To ingest a trace into trace processor, the `Parse` function can be called multiple times to with chunks of the trace and `NotifyEndOfFile` can be called at the end.
+
+As this is a common task, a helper function `ReadTrace` is provided in [include/perfetto/trace_processor/read_trace.h](/include/perfetto/trace_processor/read_trace.h). This will read a trace file directly from the filesystem and calls into appropriate `TraceProcessor`functions to perform parsing.
+
+### Executing queries
+
+The `ExecuteQuery` function can be called with an SQL statement to execute. This will return an iterator which can be used to retrieve rows in a streaming fashion.
+
+WARNING: embedders should ensure that the iterator is forwarded using `Next` before any other functions are called on the iterator.
+
+WARNING: embedders should ensure that the status of the iterator is checked after every row and at the end of iteration to verify that the query was successful.
+
+### Metrics
+
+Any registered metrics can be computed using using the `ComputeMetric` function. Any metric in `src/trace_processor/metrics` is built-in to trace processor so can be called without any other steps.
+
+Metrics can also be registered at run time using the `RegisterMetric` and `ExtendMetricsProto` functions. These can subsequently be executed with `ComputeMetric`.
+
+WARNING: embedders should ensure that the path of any registered metric is consistent with the the name used to execute the metric and output view in the SQL.
+
+### Annotations
+
+The `DescribeSlice` function is exposed to SQL through the `describe_slice` table. This table has the following schema:
+
+| Name        | Type   | Meaning                                                      |
+| :---------- | ------ | ------------------------------------------------------------ |
+| description | string | Provides the description for the given slice                 |
+| doc_link    | string | Provides a hyperlink to documentation which gives more context for the slice |
+
+The table also has a hidden column `slice_id` which needs to be set equal to the id of the slice for which to get the description. For example, to get the description and doc link for slice with id `5`:
+
+```sql
+select description, doc_link
+from describe_slice
+where slice_id = 5
+```
+
+The `describe_slice` table can also be _joined_ with the slice table to obtain descriptions for more than one slice. For example, to get the `ts`, `dur` and `description` for all `measure` slices:
+
+```sql
+select ts, dur, description
+from slice s
+join desribe_slice d on s.id = d.slice_id
+where name = 'measure'
+```
+
+### Creating derived events
+
+As creating derived events is tied to the metrics subsystem, the `ComputeMetrics` function in the trace processor API should be called with the appropriate metrics. This will create the `<metric_name>_annotations` table/view which can then be queried using the `ExectueQuery` function.
+
+NOTE: At some point, there are plans to add an API which does not create the metrics proto but just executes the queries in the metric.
+
diff --git a/docs/contributing/getting-started.md b/docs/contributing/getting-started.md
new file mode 100644
index 0000000..8cb27ec
--- /dev/null
+++ b/docs/contributing/getting-started.md
@@ -0,0 +1,84 @@
+# Contributing to Perfetto
+
+## Repository
+
+This project uses [Android AOSP Gerrit][perfetto-gerrit] for code reviews,
+follows the [Google C++ style][google-cpp-style], and targets `-std=c++11`.
+
+Development happens in the AOSP repository:
+https://android.googlesource.com/platform/external/perfetto/
+
+https://github.com/google/perfetto is an up-to-date and actively maintained
+read-only mirror of the above. Pull requests through GitHub are not accepted.
+
+## Code Reviews
+
+All submissions, including submissions by project members, require review.
+We use [Android AOSP Gerrit][perfetto-gerrit] for this purpose.
+
+`git cl upload` from [Chromium depot tools][depot-tools] is the preferred
+workflow to upload patches, as it takes care of runing presubmit tests,
+build-file generators and code formatting.
+
+If you submit code directly through `repo` and your CL touches build files or
+.proto files, it's very likely that it will fail in the CI because the
+aforementioned generators are bypassed.
+
+## Continuous integration
+
+There are two levels of CI / TryBots involved when submitting a Perfetto CL:
+
+- [ci.perfetto.dev](https://ci.perfetto.dev): it covers building and testing
+  on most platforms and toolchains within ~15 mins. Anecdotally most build
+  failures and bugs are detected at the Perfetto CI level.
+
+- The [Android CI](https://ci.android.com) (also known as TreeHugger) builds a
+  full system image and runs full integration tests within ~2-4 hours. This can
+  shake a number of more rare integration bugs, often related with SELinux,
+  initrc files or similar.
+
+Both CIs are kicked in when the `Presubmit-Ready: +1` is set and will publish a
+comment like [this][ci-example] on the CL.
+
+You need to wait for both CIs to go green before submitting. The only
+exceptions are UI-only, docs-only or GN-only changes, for which the Android CI
+can be bypassed, as those are not built as part of the Android tree.
+
+## Community
+
+You can reach us on our [Discord channel](https://discord.gg/35ShE3A).
+If you prefer using IRC we have an experimental Discord <> IRC bridge
+synced with `#perfetto-dev` on [Freenode](https://webchat.freenode.net/).
+
+Mailing list: https://groups.google.com/forum/#!forum/perfetto-dev
+
+This project follows
+[Google's Open Source Community Guidelines](https://opensource.google/conduct/).
+
+### Bugs
+
+For bugs affecting Android or the tracing internals:
+
+* **Googlers**: use the internal bug tracker [go/perfetto-bugs](http://goto.google.com/perfetto-bugs)
+* **Non-Googlers**: use [GitHub issues](https://github.com/google/perfetto/issues).
+
+For bugs affecting Chrome Tracing:
+
+* Use http://crbug.com `Component:Speed>Tracing label:Perfetto`.
+
+## Contributor License Agreement
+
+Contributions to this project must be accompanied by a Contributor License
+Agreement. You (or your employer) retain the copyright to your contribution;
+this simply gives us permission to use and redistribute your contributions as
+part of the project. Head over to <https://cla.developers.google.com/> to see
+your current agreements on file or to sign a new one.
+
+You generally only need to submit a CLA once, so if you've already submitted one
+(even if it was for a different project), you probably don't need to do it
+again.
+
+[perfetto-gerrit]: https://android-review.googlesource.com/q/project:platform%252Fexternal%252Fperfetto+status:open
+[google-cpp-style]: https://google.github.io/styleguide/cppguide.html
+[depot-tools]: https://dev.chromium.org/developers/how-tos/depottools
+[ci-example]: https://android-review.googlesource.com/c/platform/external/perfetto/+/1108253/3#message-09fd27fb92ca8357abade3ec725919ac3445f3af
diff --git a/docs/testing.md b/docs/contributing/testing.md
similarity index 95%
rename from docs/testing.md
rename to docs/contributing/testing.md
index 5e6d8f3..8baca32 100644
--- a/docs/testing.md
+++ b/docs/contributing/testing.md
@@ -1,4 +1,4 @@
-# Testing Perfetto
+# Running tests

 The testing strategy for Perfetto is rather complex due to the wide variety
 of build configurations and embedding targets.
@@ -36,7 +36,7 @@
 1B) Start the build-in emulator (supported on Linux and MacOS):

 ```bash
-tools/install-build-deps
+tools/install-build-deps --android
 tools/run_android_emulator &
 ```

@@ -50,10 +50,10 @@
 ------------------
 Perfetto is tested in a variety of locations:

-**Perfetto CI**: https:/ci.perfetto.dev/
+**Perfetto CI**: https://ci.perfetto.dev/
 Builds and runs perfetto_{unittests,integrationtests,benchmarks} from the
 standalone checkout. Benchmarks are ran in a reduced form for smoke testing.
-See [this doc](/docs/continuous-integration.md) for more details.
+See [this doc](/docs/design-docs/continuous-integration.md) for more details.

 **Android CI** (see go/apct and go/apct-guide):
 runs only `perfetto_integrationtests`
diff --git a/docs/data-sources/android-log.md b/docs/data-sources/android-log.md
new file mode 100644
index 0000000..1140c19
--- /dev/null
+++ b/docs/data-sources/android-log.md
@@ -0,0 +1,75 @@
+# Android Log
+
+_This data source is supported only on Android userdebug builds._
+
+The "android.log" data source records log events from the Android log
+daemon (`logd`). These are the same log messages that are available via
+`adb logcat`.
+
+Both textual events and binary-formatted events from the [EventLog] are
+supported.
+
+This allows you to see log events time-synced with the rest of the trace. When recording
+[long traces](/docs/concepts/config#long-traces), it allows you to record event
+logs indefinitely, regardless of the Android log daemon buffer size
+(i.e. log events are periodically fetched and copied into the trace buffer).
+
+The data source can be configured to filter event from specific log buffers and
+keep only the events matching specific tags or priority.
+
+[EventLog]: https://developer.android.com/reference/android/util/EventLog
+
+### UI
+
+At the UI level, log events are showed in two widgets:
+
+1. A summary track that allows to quickly glance at the distribution of events
+ and their severity on the timeline.
+
+2. A table, time-synced with the viewport, that allows to see events within the
+ selected time range.
+
+
+
+### SQL
+
+```sql
+select l.ts, t.tid, p.pid, p.name as process, l.prio, l.tag, l.msg
+from android_logs as l left join thread as t using(utid) left join process as p using(upid)
+```
+ts | tid | pid | process | prio | tag | msg
+---|-----|-----|---------|------|-----|----
+291474737298264 | 29128 | 29128 | traced_probes | 4 | perfetto | probes_producer.cc:231 Ftrace setup (target_buf=1)
+291474852699265 | 625 | 625 | surfaceflinger | 3 | SurfaceFlinger | Finished setting power mode 1 on display 0
+291474853274109 | 1818 | 1228 | system_server | 3 | SurfaceControl | Excessive delay in setPowerMode()
+291474882474841 | 1292 | 1228 | system_server | 4 | DisplayPowerController | Unblocked screen on after 242 ms
+291474918246615 | 1279 | 1228 | system_server | 4 | am_pss | Pid=28568 UID=10194 Process Name="com.google.android.apps.fitness" Pss=12077056 Uss=10723328 SwapPss=183296 Rss=55021568 StatType=0 ProcState=18 TimeToCollect=51
+
+### TraceConfig
+
+Trace proto:
+[AndroidLogConfig](/docs/reference/trace-packet-proto.autogen#AndroidLogConfig)
+
+Config proto:
+[AndroidPowerConfig](/docs/reference/trace-config-proto.autogen#AndroidPowerConfig)
+
+Sample config:
+
+```protobuf
+data_sources: {
+ config {
+ name: "android.log"
+ android_log_config {
+ min_prio: PRIO_VERBOSE
+ filter_tags: "perfetto"
+ filter_tags: "my_tag_2"
+ log_ids: LID_DEFAULT
+ log_ids: LID_RADIO
+ log_ids: LID_EVENTS
+ log_ids: LID_SYSTEM
+ log_ids: LID_CRASH
+ log_ids: LID_KERNEL
+ }
+ }
+}
+```
diff --git a/docs/data-sources/atrace.md b/docs/data-sources/atrace.md
new file mode 100644
index 0000000..0df13c7
--- /dev/null
+++ b/docs/data-sources/atrace.md
@@ -0,0 +1,116 @@
+# ATrace: Android system and app trace events
+
+On Android, native and managed apps can inject custom slices and counter trace
+points into the trace. This is possible through the following:
+
+* Java/Kotlin apps (SDK): `android.os.Trace`.
+ See https://developer.android.com/reference/android/os/Trace.
+
+* Native processes (NDK): `ATrace_beginSection() / ATrace_setCounter()` defined
+ in `<trace.h>`. See https://developer.android.com/ndk/reference/group/tracing.
+
+* Android internal processes: `ATRACE_BEGIN()/ATRACE_INT()` defined in
+ [`libcutils/trace.h`][libcutils].
+
+This API has been available since Android 4.3 (API level 18) and predates
+Perfetto. All these annotations, which internally are all routed through the
+internal libcutils API, are and will continue to be supported by Perfetto.
+
+There are two types of atrace events: System and App events.
+
+**System events**: are emitted only by Android internals using libcutils.
+These events are grouped in categories (also known as _tags_), e.g.
+"am" (ActivityManager), "pm" (PackageManager).
+For a full list of categories see the _Record new trace_ page of the
+[Perfetto UI](https://ui.perfetto.dev).
+
+Categories can be used to enable group of events across several processes,
+without having to worry about which particular system process emits them.
+
+**App events**: have the same semantics of system events. Unlike system events,
+however, they don't have any tag-filtering capability (all app events share the
+same tag `ATRACE_TAG_APP`) but can be enabled on a per-app basis.
+
+See the [TraceConfig](#traceconfig) section below for instructions on how to
+enable both system and app events.
+
+#### Instrumentation overhead
+
+ATrace instrumentation a non-negligible cost of 1-10us per event.
+This is because each event involves a stringification, a JNI call if coming from
+a managed execution environment, and a user-space <-> kernel-space roundtrip to
+write the marker into `/sys/kernel/debug/tracing/trace_marker` (which is the
+most expensive part).
+
+Our team is are looking into a migration path for Android, in light of the newly
+introduced [Tracing SDK](/docs/instrumentation/tracing-sdk.md). At the moment
+the advice is to keep using the existing ATrace API on Android.
+
+[libcutils]: https://cs.android.com/android/platform/superproject/+/master:system/core/libcutils/include/cutils/trace.h?q=f:trace%20libcutils
+
+## UI
+
+At the UI level, these functions create slices and counters within the scope of
+a process track group, as follows:
+
+
+
+## SQL
+
+At the SQL level, ATrace events are available in the standard `slice` and
+`counter` tables, together with other counters and slices coming from other
+data sources.
+
+### Slices
+
+```sql
+select s.ts, t.name as thread_name, t.tid, s.name as slice_name, s.dur
+from slice as s left join thread_track as trk on s.track_id = trk.id
+left join thread as t on trk.utid = t.utid
+```
+
+ts | thread_name | tid | slice_name | dur
+---|-------------|-----|------------|----
+261190068051612 | android.anim | 1317 | dequeueBuffer | 623021
+261190068636404 | android.anim | 1317 | importBuffer | 30312
+261190068687289 | android.anim | 1317 | lockAsync | 2269428
+261190068693852 | android.anim | 1317 | LockBuffer | 2255313
+261190068696300 | android.anim | 1317 | MapBuffer | 36302
+261190068734529 | android.anim | 1317 | CleanBuffer | 2211198
+
+### Counters
+
+```sql
+select ts, p.name as process_name, p.pid, t.name as counter_name, c.value
+from counter as c left join process_counter_track as t on c.track_id = t.id
+left join process as p on t.upid = p.upid
+```
+
+ts | process_name | pid | counter_name | value
+---|--------------|-----|--------------|------
+261193227069635 | com.android.systemui | 1664 | GPU completion | 0
+261193268649379 | com.android.systemui | 1664 | GPU completion | 1
+261193269787139 | com.android.systemui | 1664 | HWC release | 1
+261193270330890 | com.android.systemui | 1664 | GPU completion | 0
+261193271282244 | com.android.systemui | 1664 | GPU completion | 1
+261193277112817 | com.android.systemui | 1664 | HWC release | 0
+
+## TraceConfig
+
+```protobuf
+data_sources {
+ config {
+ name: "linux.ftrace"
+ ftrace_config {
+ // Enables specific system events tags.
+ atrace_categories: "am"
+ atrace_categories: "pm"
+
+ // Enables events for a specific app.
+ atrace_apps: "com.google.android.apps.docs"
+
+ // Enables all events for all apps.
+ atrace_apps: "*"
+ }
+ }
+```
diff --git a/docs/data-sources/battery-counters.md b/docs/data-sources/battery-counters.md
new file mode 100644
index 0000000..89f6668
--- /dev/null
+++ b/docs/data-sources/battery-counters.md
@@ -0,0 +1,153 @@
+# Power data sources
+
+On Android Perfetto bundles data sources to retrieve power
+counters from the device power management units (where supported).
+
+## Battery counters
+
+_This data source has been introduced in Android 10 (Q) and requires the
+presence of power-management hardware on the device. This is available on
+most Google Pixel smartphones._
+
+Modern smartphones are equipped with a power monitoring IC which is able to
+measure the charge flowing in and out of the battery. This allows Perfetto to
+observe the total and instantaneous charge drained from the battery by the
+overall device (the union of SoC, display, radios and all other hardware
+units).
+
+A simplified block diagram:
+
+
+
+These counters report:
+
+* The remaining battery capacity in %.
+* The remaining battery charge in microampere-hours (µAh).
+* The instantaneous (typically the average over a small window of time) current
+ in microampere (µA)
+
+The presence and the resolution of these counters depends on the device
+manufacturer. At the platform level this data is obtained polling the
+Android [IHealth HAL][health-hal].
+For more details on HW specs and resolution see
+[Measuring Device Power](https://source.android.com/devices/tech/power/device).
+
+[health-hal]: https://cs.android.com/android/platform/superproject/+/master:hardware/interfaces/health/2.0/IHealth.hal?q=IHealth
+
+#### Measuring charge while plugged on USB
+
+Battery counters measure the charge flowing *in* and *out* of
+the battery. If the device is plugged to a USB cable, you will likely observe
+a negative instantaneous current and an increase of the total charge, denoting
+the fact that charge is flowing in the battery (i.e. charging it) rather
+than out.
+
+This can make measurements in lab settings problematic. The known workarounds
+for this are:
+
+* Using specialized USB hubs that allow to electrically disconnect the USB ports
+ from the host side. This allows to effectively disconnect the phone while the
+ tests are running.
+
+* On rooted phones the power management IC driver allows to disconnect the USB
+ charging while keeping the USB data link active. This feature is
+ SoC-specific, is undocumented and not exposed through any HAL.
+ For instance on a Pixel 2 this can be achieved running, as root:
+ `echo 1 > /sys/devices/soc/800f000.qcom,spmi/spmi-0/spmi0-02/800f000.qcom,spmi:qcom,pmi8998@2:qcom,qpnp-smb2/power_supply/battery/input_suspend`.
+ Note that in most devices the kernel USB driver holds a wakelock to keep the
+ USB data link active, so the device will never fully suspend even when turning
+ the screen off.
+
+### UI
+
+
+
+### SQL
+
+```sql
+select ts, t.name, value from counter as c left join counter_track t on c.track_id = t.id
+```
+
+ts | name | value
+---|------|------
+338297039804951 | batt.charge_uah | 2085000
+338297039804951 | batt.capacity_pct | 75
+338297039804951 | batt.current_ua | -1469687
+338297145212097 | batt.charge_uah | 2085000
+338297145212097 | batt.capacity_pct | 75
+338297145212097 | batt.current_ua | -1434062
+
+### TraceConfig
+
+Trace proto:
+[BatteryCounters](/docs/reference/trace-packet-proto.autogen#BatteryCounters)
+
+Config proto:
+[AndroidPowerConfig](/docs/reference/trace-config-proto.autogen#AndroidPowerConfig)
+
+Sample config:
+
+```protobuf
+data_sources: {
+ config {
+ name: "android.power"
+ android_power_config {
+ battery_poll_ms: 250
+ battery_counters: BATTERY_COUNTER_CAPACITY_PERCENT
+ battery_counters: BATTERY_COUNTER_CHARGE
+ battery_counters: BATTERY_COUNTER_CURRENT
+ }
+ }
+}
+```
+
+## Power rails
+
+_This data source has been introduced in Android 10 (Q) and requires the
+dedicated hardware on the device. This hardware is not yet available on
+most production phones._
+
+Recent version of Android introduced the support for more advanced power
+monitoring at the hardware subsystem level, known as "Power rail counters".
+These counters measure the energy drained by (groups of) hardware units.
+
+Unlike the battery counters, they are not affected by the charging/discharging
+state of the battery, because they measure power downstream of the battery.
+
+The presence and the resolution of power rail counters depends on the device
+manufacturer. At the platform level this data is obtained polling the
+Android [IPowerStats HAL][power-hal].
+
+[power-hal]: https://cs.android.com/android/platform/superproject/+/master:hardware/interfaces/power/stats/1.0/IPowerStats.hal
+
+Simplified block diagram:
+
+
+
+### TraceConfig
+
+Trace proto:
+[PowerRails](/docs/reference/trace-packet-proto.autogen#PowerRails)
+
+Config proto:
+[AndroidPowerConfig](/docs/reference/trace-config-proto.autogen#AndroidPowerConfig)
+
+Sample config:
+
+```protobuf
+data_sources: {
+ config {
+ name: "android.power"
+ android_power_config {
+ battery_poll_ms: 250
+ collect_power_rails: true
+ # Note: it is possible to specify both rails and battery counters
+ # in this section.
+ }
+ }
+}
+```
+
+## Related data sources
+
+See also the [CPU -> Frequency scaling](cpu-freq.md) data source.
diff --git a/docs/data-sources/cpu-freq.md b/docs/data-sources/cpu-freq.md
new file mode 100644
index 0000000..73a7f8e
--- /dev/null
+++ b/docs/data-sources/cpu-freq.md
@@ -0,0 +1,119 @@
+# CPU frequency and idle states
+
+This data source is available on Linux and Android (Since P).
+It records changes in the CPU power management scheme through the
+Linux kernel ftrace infrastructure.
+It involves three aspects:
+
+#### Frequency scaling
+
+Records changes in the frequency of a CPU. An event is emitted every time the
+scaling governor scales the CPU frequency up or down.
+
+On most Android devices the frequency scaling is per-cluster (group of
+big/little cores) so it's not unusual to see groups of four CPUs changing
+frequency at the same time.
+
+#### idle states
+
+When no threads are eligible to be executed (e.g. they are all in sleep states)
+the kernel sets the CPU into an idle state, turning off some of the circuitry
+to reduce idle power usage. Most modern CPUs have more than one idle state:
+deeper idle states use less power but also require more time to resume from.
+
+Note that idle transitions are relatively fast and cheap, a CPU can enter and
+leave idle states hundreds of times in a second.
+Idle-ness must not be confused with full device suspend, which is a stronger and
+more invasive power saving state (See below). CPUs can be idle even when the
+screen is on and the device looks operational.
+
+The details about how many idle states are available and their semantic is
+highly CPU/SoC specific. At the trace level, the idle state 0 means not-idle,
+values greater than 0 represent increasingly deeper power saving states
+(e.g., single core idle -> full package idle).
+
+Note that most Android devices won't enter idle states as long as the USB
+cable is plugged in (the USB driver stack holds wakelocks). It is not unusual
+to see only one idle state in traces collected through USB.
+
+On most SoCs the frequency has little value when the CPU is idle, as the CPU is
+typically clock-gated in idle states. In those cases the frequency in the trace
+happens to be the last frequency the CPU was running at before becoming idle.
+
+Known issues:
+
+* The event is emitted only when the frequency changes. This might
+ not happen for long periods of times. In short traces
+ it's possible that some CPU might not report any event, showing a gap on the
+ left-hand side of the trace, or none at all. Perfetto doesn't currently record
+ the initial cpu frequency when the trace is started.
+
+* Currently the UI doesn't render the cpufreq track if idle states (see below)
+ are not captured. This is a UI-only bug, data is recorded and query-able
+ through trace processor even if not displayed.
+
+### UI
+
+In the UI, CPU frequency and idle-ness are shown on the same track. The height
+of the track represents the frequency, the coloring represents the idle
+state (colored: not-idle, gray: idle). Hovering or clicking a point in the
+track will reveal both the frequency and the idle state:
+
+
+
+### SQL
+
+At the SQL level, both frequency and idle states are modeled as counters,
+Note that the cpuidle value 0xffffffff (4294967295) means _back to not-idle_.
+
+```sql
+select ts, t.name, cpu, value from counter as c
+left join cpu_counter_track as t on c.track_id = t.id
+where t.name = 'cpuidle' or t.name = 'cpufreq'
+```
+
+ts | name | cpu | value
+---|------|------|------
+261187013242350 | cpuidle | 1 | 0
+261187013246204 | cpuidle | 1 | 4294967295
+261187013317818 | cpuidle | 1 | 0
+261187013333027 | cpuidle | 0 | 0
+261187013338287 | cpufreq | 0 | 1036800
+261187013357922 | cpufreq | 1 | 1036800
+261187013410735 | cpuidle | 1 | 4294967295
+261187013451152 | cpuidle | 0 | 4294967295
+261187013665683 | cpuidle | 1 | 0
+261187013845058 | cpufreq | 0 | 1900800
+
+### TraceConfig
+
+```protobuf
+data_sources: {
+ config {
+ name: "linux.ftrace"
+ ftrace_config {
+ ftrace_events: "power/cpu_frequency"
+ ftrace_events: "power/cpu_idle"
+ ftrace_events: "power/suspend_resume"
+ }
+ }
+}
+```
+
+### Full-device suspend
+
+Full device suspend happens when a laptop is put in "sleep" mode (e.g. by
+closing the lid) or when a smartphone display is turned off for enough time.
+
+When the device is suspended, most of the hardware units are turned off entering
+the highest power-saving state possible (other than full shutdown).
+
+Note that most Android devices don't suspend immediately after dimming the
+display but tend to do so if the display is forced off through the power button.
+The details are highly device/manufacturer/kernel specific.
+
+Known issues:
+
+* The UI doesn't display clearly the suspended state. When an Android device
+ suspends it looks like as if all CPUs are running the kmigration thread and
+ one CPU is running the power HAL.
diff --git a/docs/data-sources/cpu-scheduling.md b/docs/data-sources/cpu-scheduling.md
new file mode 100644
index 0000000..8b771e8
--- /dev/null
+++ b/docs/data-sources/cpu-scheduling.md
@@ -0,0 +1,149 @@
+# CPU Scheduling events
+
+On Android and Linux Perfetto can gather scheduler traces via the Linux Kernel
+[ftrace](https://www.kernel.org/doc/Documentation/trace/ftrace.txt)
+infrastructure.
+
+This allows to get fine grained scheduling events such as:
+
+* Which threads were scheduling on which CPU cores at any point in time, with
+ nanosecond accuracy.
+* The reason why a running thread got descheduled (e.g. pre-emption, blocked on
+ a mutex, blocking syscall or any other wait queue).
+* The point in time when a thread became eligible to be executed, even if it was
+ not put immediately on any CPU run queue, together with the source thread that
+ made it executable.
+
+## UI
+
+When zoomed out, the UI shows a quantized view of CPU usage, which collapses the
+scheduling information:
+
+
+
+However, by zooming in, the individual scheduling events become visible:
+
+
+
+Clicking on a CPU slice shows the relevant information in the details panel:
+
+
+
+Scrolling down, when expanding individual processes, the scheduling events also
+create one track for each thread, which allows to follow the evolution of the
+state of individual threads:
+
+
+
+
+```protobuf
+data_sources {
+ config {
+ name: "linux.ftrace"
+ ftrace_config {
+ ftrace_events: "sched/sched_switch"
+ ftrace_events: "sched/sched_waking"
+ }
+ }
+}
+```
+
+## SQL
+
+At the SQL level, the scheduling data is exposed in the
+[`sched_slice`](/docs/analysis/sql-tables.autogen#sched_slice) table.
+
+```sql
+select ts, dur, cpu, end_state, priority, process.name, thread.name
+from sched_slice left join thread using(utid) left join process using(upid)
+```
+
+ts | dur | cpu | end_state | priority | process.name, | thread.name
+---|-----|-----|-----------|----------|---------------|------------
+261187012170995 | 247188 | 2 | S | 130 | /system/bin/logd | logd.klogd
+261187012418183 | 12812 | 2 | D | 120 | /system/bin/traced_probes | traced_probes0
+261187012421099 | 220000 | 4 | D | 120 | kthreadd | kworker/u16:2
+261187012430995 | 72396 | 2 | D | 120 | /system/bin/traced_probes | traced_probes1
+261187012454537 | 13958 | 0 | D | 120 | /system/bin/traced_probes | traced_probes0
+261187012460318 | 46354 | 3 | S | 120 | /system/bin/traced_probes | traced_probes2
+261187012468495 | 10625 | 0 | R | 120 | [NULL] | swapper/0
+261187012479120 | 6459 | 0 | D | 120 | /system/bin/traced_probes | traced_probes0
+261187012485579 | 7760 | 0 | R | 120 | [NULL] | swapper/0
+261187012493339 | 34896 | 0 | D | 120 | /system/bin/traced_probes | traced_probes0
+
+## TraceConfig
+
+```protobuf
+data_sources: {
+ config {
+ name: "linux.ftrace"
+ ftrace_config {
+ ftrace_events: "sched/sched_switch"
+ ftrace_events: "sched/sched_process_exit"
+ ftrace_events: "sched/sched_process_free"
+ ftrace_events: "task/task_newtask"
+ ftrace_events: "task/task_rename"
+ }
+ }
+}
+
+# This is to get full process name and thread<>process relationships.
+data_sources: {
+ config {
+ name: "linux.process_stats"
+ }
+}
+```
+
+## Scheduling wakeups and latency analysis
+
+By further enabling the following in the TraceConfig, the ftrace data source
+will record also scheduling wake up events:
+
+```protobuf
+ ftrace_events: "sched/sched_wakeup_new"
+ ftrace_events: "sched/sched_waking"
+```
+
+While `sched_switch` events are emitted only when a thread is in the
+`R(unnable)` state AND is running on a CPU run queue, `sched_waking` events are
+emitted when any event causes a thread state to change.
+
+Consider the following example:
+
+```
+Thread A
+condition_variable.wait()
+ Thread B
+ condition_variable.notify()
+```
+
+When Thread A suspends on the wait() it will enter the state `S(sleeping)` and
+get removed from the CPU run queue. When Thread B notifies the variable, the
+kernel will transition Thread A into the `R(unnable)` state. Thread A at that
+point is eligible to be put back on a run queue. However this might not happen
+for some time because, for instance:
+
+* All CPUs might be busy running some other thread, and Thread A needs to wait
+ to get a run queue slot assigned (or the other threads have higher priority).
+* Some other CPUs other than the current one, but the scheduler load balancer
+ might take some time to move the thread on another CPU.
+
+Unless using real-time thread priorities, most Linux Kernel scheduler
+configurations are not strictly work-conserving. For instance the scheduler
+might prefer to wait some time in the hope that the thread running on the
+current CPU goes to idle, avoiding a cross-cpu migration which might be more
+costly both in terms of overhead and power.
+
+NOTE: `sched_waking` and `sched_wakeup` provide nearly the same information. The
+ difference lies in wakeup events across CPUs, which involve
+ inter-processor interrupts. The former is emitted on the source (wakee)
+ CPU, the latter on the destination (waked) CPU. `sched_waking` is usually
+ sufficient for latency analysis, unless you are looking into breaking down
+ latency due to inter-processor signaling.
+
+When enabling `sched_waking` events, the following will appear in the UI when
+selecting a CPU slice:
+
+
+
diff --git a/docs/data-sources/gpu.md b/docs/data-sources/gpu.md
new file mode 100644
index 0000000..6612afc
--- /dev/null
+++ b/docs/data-sources/gpu.md
@@ -0,0 +1,43 @@
+# GPU
+
+
+
+## GPU Frequency
+
+GPU frequency can be included in the trace by adding the ftrace category.
+
+```
+data_sources: {
+ config {
+ name: "linux.ftrace"
+ ftrace_config {
+ ftrace_events: "power/gpu_frequency"
+ }
+ }
+}
+```
+
+## GPU Counters
+
+GPU counters can be configured by adding the data source to the trace config as follows:
+
+```
+data_sources: {
+ config {
+ name: "gpu.counters"
+ gpu_counter_config {
+ counter_period_ns: 1000000
+ counter_ids: 1
+ counter_ids: 3
+ counter_ids: 106
+ counter_ids: 107
+ counter_ids: 109
+ }
+ }
+}
+```
+
+The counter_ids correspond to the ones described in `GpuCounterSpec` in the data source descriptor.
+
+See the full configuration options in [gpu\_counter\_config.proto](/protos/perfetto/config/gpu/gpu_counter_config.proto)
+
diff --git a/docs/data-sources/java-heap-profiler.md b/docs/data-sources/java-heap-profiler.md
new file mode 100644
index 0000000..5168d7d
--- /dev/null
+++ b/docs/data-sources/java-heap-profiler.md
@@ -0,0 +1,88 @@
+# Memory: Java heap profiler
+
+NOTE: The Java heap profiler requires Android 11 or higher
+
+See the [Memory Guide](/docs/case-studies/memory.md#java-hprof) for getting
+started with Java heap profiling.
+
+Conversely from the [Native heap profiler](native-heap-profiler.md), the Java
+heap profiler reports full retention graphs of managed objects but not
+call-stacks. The information recorded by the Java heap profiler is of the form:
+_Object X retains object Y, which is N bytes large, through its class member
+named Z_.
+
+## UI
+
+Heap graph dumps are shown as flamegraphs in the UI after clicking on the
+diamond in the _"Heap Profile"_ track of a process. Each diamond corresponds to
+a heap dump.
+
+
+
+
+
+## SQL
+
+Information about the Java Heap is written to the following tables:
+
+* [`heap_graph_class`](/docs/analysis/sql-tables.autogen#heap_graph_class)
+* [`heap_graph_object`](/docs/analysis/sql-tables.autogen#heap_graph_object)
+* [`heap_graph_reference`](/docs/analysis/sql-tables.autogen#heap_graph_reference)
+
+For instance, to get the bytes used by class name, run the following query.
+As-is this query will often return un-actionable information, as most of the
+bytes in the Java heap end up being primitive arrays or strings.
+
+```sql
+select c.name, sum(o.self_size)
+ from heap_graph_object o join heap_graph_class c on (o.type_id = c.id)
+ where reachable = 1 group by 1 order by 2 desc;
+```
+
+|name |sum(o.self_size) |
+|--------------------|--------------------|
+|java.lang.String | 2770504|
+|long[] | 1500048|
+|int[] | 1181164|
+|java.lang.Object[] | 624812|
+|char[] | 357720|
+|byte[] | 350423|
+
+We can use `experimental_flamegraph` to normalize the graph into a tree, always
+taking the shortest path to the root and get cumulative sizes.
+Note that this is **experimental** and the **API is subject to change**.
+From this we can see how much memory is being held by each type of object
+
+```sql
+select name, cumulative_size
+ from experimental_flamegraph(56785646801, 1, 'graph')
+ order by 2 desc;
+```
+
+| name | cumulative_size |
+|------|-----------------|
+|java.lang.String|1431688|
+|java.lang.Class<android.icu.text.Transliterator>|1120227|
+|android.icu.text.TransliteratorRegistry|1119600|
+|com.android.systemui.statusbar.phone.StatusBarNotificationPresenter$2|1086209|
+|com.android.systemui.statusbar.phone.StatusBarNotificationPresenter|1085593|
+|java.util.Collections$SynchronizedMap|1063376|
+|java.util.HashMap|1063292|
+
+## TraceConfig
+
+The Java heap profiler is configured through the
+[JavaHprofConfig](/docs/reference/trace-config-proto.autogen#JavaHprofConfig)
+section of the trace config.
+
+```protobuf
+data_sources {
+ config {
+ name: "android.java_hprof"
+ java_hprof_config {
+ process_cmdline: "com.google.android.inputmethod.latin"
+ dump_smaps: true
+ }
+ }
+}
+```
diff --git a/docs/data-sources/memory-counters.md b/docs/data-sources/memory-counters.md
new file mode 100644
index 0000000..f2bbabd
--- /dev/null
+++ b/docs/data-sources/memory-counters.md
@@ -0,0 +1,410 @@
+# Memory counters and events
+
+Perfetto allows to gather a number of memory events and counters on
+Android and Linux. These events come from kernel interfaces, both ftrace and
+/proc interfaces, and are of two types: polled counters and events pushed by
+the kernel in the ftrace buffer.
+
+## Per-process polled counters
+
+The process stats data source allows to poll `/proc/<pid>/status` and
+`/proc/<pid>/oom_score_adj` at user-defined intervals.
+
+See [`man 5 proc`][man-proc] for their semantic.
+
+### UI
+
+
+
+### SQL
+
+```sql
+select c.ts, c.value, t.name as counter_name, p.name as proc_name, p.pid
+from counter as c left join process_counter_track as t on c.track_id = t.id
+left join process as p using (upid)
+where t.name like 'mem.%'
+```
+ts | counter_name | value_kb | proc_name | pid
+---|--------------|----------|-----------|----
+261187015027350 | mem.virt | 1326464 | com.android.vending | 28815
+261187015027350 | mem.rss | 85592 | com.android.vending | 28815
+261187015027350 | mem.rss.anon | 36948 | com.android.vending | 28815
+261187015027350 | mem.rss.file | 46560 | com.android.vending | 28815
+261187015027350 | mem.swap | 6908 | com.android.vending | 28815
+261187015027350 | mem.rss.watermark | 102856 | com.android.vending | 28815
+261187090251420 | mem.virt | 1326464 | com.android.vending | 28815
+
+### TraceConfig
+
+To collect process stat counters every X ms set `proc_stats_poll_ms = X` in
+your process stats config. X must be greater than 100ms to avoid excessive CPU
+usage. Details about the specific counters being collected can be found in the
+[ProcessStats reference](/docs/reference/trace-packet-proto.autogen#ProcessStats).
+
+```protobuf
+data_sources: {
+ config {
+ name: "linux.process_stats"
+ process_stats_config {
+ scan_all_processes_on_start: true
+ proc_stats_poll_ms: 1000
+ }
+ }
+}
+```
+
+## Per-process memory events (ftrace)
+
+### rss_stat
+
+Recent versions of the Linux kernel allow to report ftrace events when the
+Resident Set Size (RSS) mm counters change. This is the same counter available
+in `/proc/pid/status` as `VmRSS`. The main advantage of this event is that by
+being an event-driven push event it allows to detect very short memory usage
+bursts that would be otherwise undetectable by using /proc counters.
+
+Memory usage peaks of hundreds of MB can have dramatically negative impact on
+Android, even if they last only few ms, as they can cause mass low memory kills
+to reclaim memory.
+
+The kernel feature that supports this has been introduced in the Linux Kernel
+in [b3d1411b6] and later improved by [e4dcad20]. They are available in upstream
+since Linux v5.5-rc1. This patch has been backported in several Google Pixel
+kernels running Android 10 (Q).
+
+[b3d1411b6]: https://github.com/torvalds/linux/commit/b3d1411b6726ea6930222f8f12587d89762477c6
+[e4dcad20]: https://github.com/torvalds/linux/commit/e4dcad204d3a281be6f8573e0a82648a4ad84e69
+
+### mm_event
+
+`mm_event` is an ftrace event that captures statistics about key memory events
+(a subset of the ones exposed by `/proc/vmstat`). Unlike RSS-stat counter
+updates, mm events are extremely high volume and tracing them individually would
+be unfeasible. `mm_event` instead reports only periodic histograms in the trace,
+reducing sensibly the overhead.
+
+`mm_event` is available only on some Google Pixel kernels running Android 10 (Q)
+and beyond.
+
+When `mm_event` is enabled, the following mm event types are recorded:
+
+* mem.mm.min_flt: Minor page faults
+* mem.mm.maj_flt: Major page faults
+* mem.mm.swp_flt: Page faults served by swapcache
+* mem.mm.read_io: Read page faults backed by I/O
+* mem.mm..compaction: Memory compaction events
+* mem.mm.reclaim: Memory reclaim events
+
+For each event type, the event records:
+
+* count: how many times the event happened since the previous event.
+* min_lat: the smallest latency (the duration of the mm event) recorded since
+ the previous event.
+* max_lat: the highest latency recorded since the previous event.
+
+### UI
+
+
+
+### SQL
+
+At the SQL level, these events are imported and exposed in the same way as
+the corresponding polled events. This allows to collect both types of events
+(pushed and polled) and treat them uniformly in queries and scripts.
+
+```sql
+select c.ts, c.value, t.name as counter_name, p.name as proc_name, p.pid
+from counter as c left join process_counter_track as t on c.track_id = t.id
+left join process as p using (upid)
+where t.name like 'mem.%'
+```
+
+ts | value | counter_name | proc_name | pid
+---|-------|--------------|-----------|----
+777227867975055 | 18358272 | mem.rss.anon | com.google.android.apps.safetyhub | 31386
+777227865995315 | 5 | mem.mm.min_flt.count | com.google.android.apps.safetyhub | 31386
+777227865995315 | 8 | mem.mm.min_flt.max_lat | com.google.android.apps.safetyhub | 31386
+777227865995315 | 4 | mem.mm.min_flt.avg_lat | com.google.android.apps.safetyhub | 31386
+777227865998023 | 3 | mem.mm.swp_flt.count | com.google.android.apps.safetyhub | 31386
+
+### TraceConfig
+
+```protobuf
+data_sources: {
+ config {
+ name: "linux.ftrace"
+ ftrace_config {
+ ftrace_events: "kmem/rss_stat"
+ ftrace_events: "mm_event/mm_event_record"
+ }
+ }
+}
+
+# This is for getting Thread<>Process associations and full process names.
+data_sources: {
+ config {
+ name: "linux.process_stats"
+ }
+}
+```
+
+## System-wide polled counters
+
+This data source allows periodic polling of system data from:
+
+- `/proc/stat`
+- `/proc/vmstat`
+- `/proc/meminfo`
+
+See [`man 5 proc`][man-proc] for their semantic.
+
+### UI
+
+
+
+The polling period and specific counters to include in the trace can be set in the trace config.
+
+### SQL
+
+```sql
+select c.ts, t.name, c.value / 1024 as value_kb from counters as c left join counter_track as t on c.track_id = t.id
+```
+
+ts | name | value_kb
+---|------|---------
+775177736769834 | MemAvailable | 1708956
+775177736769834 | Buffers | 6208
+775177736769834 | Cached | 1352960
+775177736769834 | SwapCached | 8232
+775177736769834 | Active | 1021108
+775177736769834 | Inactive(file) | 351496
+
+### TraceConfig
+
+The set of supported counters is available in the
+[TraceConfig reference](/docs/reference/trace-config-proto.autogen#SysStatsConfig)
+
+```protobuf
+data_sources: {
+ config {
+ name: "linux.sys_stats"
+ sys_stats_config {
+ meminfo_period_ms: 1000
+ meminfo_counters: MEMINFO_MEM_TOTAL
+ meminfo_counters: MEMINFO_MEM_FREE
+ meminfo_counters: MEMINFO_MEM_AVAILABLE
+
+ vmstat_period_ms: 1000
+ vmstat_counters: VMSTAT_NR_FREE_PAGES
+ vmstat_counters: VMSTAT_NR_ALLOC_BATCH
+ vmstat_counters: VMSTAT_NR_INACTIVE_ANON
+ vmstat_counters: VMSTAT_NR_ACTIVE_ANON
+
+ stat_period_ms: 2500
+ stat_counters: STAT_CPU_TIMES
+ stat_counters: STAT_FORK_COUNT
+ }
+ }
+}
+```
+
+
+
+## Low-memory Kills (LMK)
+
+#### Background
+
+The Android framework kills apps and services, especially background ones, to
+make room for newly opened apps when memory is needed. These are known as low
+memory kills (LMK).
+
+Note LMKs are not always the symptom of a performance problem. The rule of thumb
+is that the severity (as in: user perceived impact) is proportional to the state
+of the app being killed. The app state can be derived in a trace from the OOM
+adjustment score.
+
+A LMK of a foreground app or service is typically a big concern. This happens
+when the app that the user was using disappeared under their fingers, or their
+favorite music player service suddenly stopped playing music.
+
+A LMK of a cached app or service, instead, is frequently business-as-usual and
+in most cases won't be noticed by the end user until they try to go back to
+the app, which will then cold-start.
+
+The situation in between these extremes is more nuanced. LMKs of cached
+apps/service can be still problematic if it happens in storms (i.e. observing
+that most processes get LMK-ed in a short time frame) and are often the symptom
+of some component of the system causing memory spikes.
+
+### lowmemorykiller vs lmkd
+
+#### In-kernel lowmemorykiller driver
+In Android, LMK used to be handled by an ad-hoc kernel-driver,
+Linux's [drivers/staging/android/lowmemorykiller.c](https://github.com/torvalds/linux/blob/v3.8/drivers/staging/android/lowmemorykiller.c).
+This driver uses to emit the ftrace event `lowmemorykiller/lowmemory_kill`
+in the trace.
+
+#### Userspace lmkd
+
+Android 9 introduced a userspace native daemon that took over the LMK
+responsibility: `lmkd`. Not all devices running Android 9 will
+necessarily use `lmkd` as the ultimate choice of in-kernel vs userspace is
+up to the phone manufacturer, their kernel version and kernel config.
+
+On Google Pixel phones, `lmkd`-side killing is used since Pixel 2 running
+Android 9.
+
+See https://source.android.com/devices/tech/perf/lmkd for details.
+
+`lmkd` emits a userspace atrace counter event called `kill_one_process`.
+
+#### Android LMK vs Linux oomkiller
+
+LMKs on Android, whether the old in-kernel `lowmemkiller` or the newer `lmkd`,
+use a completely different mechanism than the standard
+[Linux kernel's OOM Killer](https://linux-mm.org/OOM_Killer).
+Perfetto at the moment supports only Android LMK events (Both in-kernel and
+user-space) and does not support tracing of Linux kernel OOM Killer events.
+Linux OOMKiller events are still theoretically possible on Android but extremely
+unlikely to happen. If they happen, they are more likely the symptom of a
+mis-configured BSP.
+
+### UI
+
+Newer userspace LMKs are available in the UI under the `lmkd` track
+in the form of a counter. The counter value is the PID of the killed process
+(in the example below, PID=27985).
+
+
+
+TODO: we are working on a better UI support for LMKs.
+
+### SQL
+
+Both newer lmkd and legacy kernel-driven lowmemorykiler events are normalized
+at import time and available under the `mem.lmk` key in the `instants` table.
+
+```sql
+select ts, process.name, process.pid from instants left join process on instants.ref = process.upid where instants.name = 'mem.lmk'
+```
+
+| ts | name | pid |
+|----|------|-----|
+| 442206415875043 | roid.apps.turbo | 27324 |
+| 442206446142234 | android.process.acore | 27683 |
+| 442206462090204 | com.google.process.gapps | 28198 |
+
+### TraceConfig
+
+To enable tracing of low memory kills add the following options to trace config:
+
+```protobuf
+data_sources: {
+ config {
+ name: "linux.ftrace"
+ ftrace_config {
+ # For old in-kernel events.
+ ftrace_events: "lowmemorykiller/lowmemory_kill"
+
+ # For new userspace lmkds.
+ atrace_apps: "lmkd"
+
+ # This is not strictly required but is useful to know the state
+ # of the process (FG, cached, ...) before it got killed.
+ ftrace_events: "oom/oom_score_adj_update"
+ }
+ }
+}
+```
+
+## {#oom-adj} App states and OOM adjustment score
+
+The Android app state can be inferred in a trace from the process
+`oom_score_adj`. The mapping is not 1:1, there are more states than
+oom_score_adj value groups and the `oom_score_adj` range for cached processes
+spans from 900 to 1000.
+
+The mapping can be inferred from the
+[ActivityManager's ProcessList sources](https://cs.android.com/android/platform/superproject/+/android10-release:frameworks/base/services/core/java/com/android/server/am/ProcessList.java;l=126)
+
+```java
+// This is a process only hosting activities that are not visible,
+// so it can be killed without any disruption.
+static final int CACHED_APP_MAX_ADJ = 999;
+static final int CACHED_APP_MIN_ADJ = 900;
+
+// This is the oom_adj level that we allow to die first. This cannot be equal to
+// CACHED_APP_MAX_ADJ unless processes are actively being assigned an oom_score_adj of
+// CACHED_APP_MAX_ADJ.
+static final int CACHED_APP_LMK_FIRST_ADJ = 950;
+
+// The B list of SERVICE_ADJ -- these are the old and decrepit
+// services that aren't as shiny and interesting as the ones in the A list.
+static final int SERVICE_B_ADJ = 800;
+
+// This is the process of the previous application that the user was in.
+// This process is kept above other things, because it is very common to
+// switch back to the previous app. This is important both for recent
+// task switch (toggling between the two top recent apps) as well as normal
+// UI flow such as clicking on a URI in the e-mail app to view in the browser,
+// and then pressing back to return to e-mail.
+static final int PREVIOUS_APP_ADJ = 700;
+
+// This is a process holding the home application -- we want to try
+// avoiding killing it, even if it would normally be in the background,
+// because the user interacts with it so much.
+static final int HOME_APP_ADJ = 600;
+
+// This is a process holding an application service -- killing it will not
+// have much of an impact as far as the user is concerned.
+static final int SERVICE_ADJ = 500;
+
+// This is a process with a heavy-weight application. It is in the
+// background, but we want to try to avoid killing it. Value set in
+// system/rootdir/init.rc on startup.
+static final int HEAVY_WEIGHT_APP_ADJ = 400;
+
+// This is a process currently hosting a backup operation. Killing it
+// is not entirely fatal but is generally a bad idea.
+static final int BACKUP_APP_ADJ = 300;
+
+// This is a process bound by the system (or other app) that's more important than services but
+// not so perceptible that it affects the user immediately if killed.
+static final int PERCEPTIBLE_LOW_APP_ADJ = 250;
+
+// This is a process only hosting components that are perceptible to the
+// user, and we really want to avoid killing them, but they are not
+// immediately visible. An example is background music playback.
+static final int PERCEPTIBLE_APP_ADJ = 200;
+
+// This is a process only hosting activities that are visible to the
+// user, so we'd prefer they don't disappear.
+static final int VISIBLE_APP_ADJ = 100;
+
+// This is a process that was recently TOP and moved to FGS. Continue to treat it almost
+// like a foreground app for a while.
+// @see TOP_TO_FGS_GRACE_PERIOD
+static final int PERCEPTIBLE_RECENT_FOREGROUND_APP_ADJ = 50;
+
+// This is the process running the current foreground app. We'd really
+// rather not kill it!
+static final int FOREGROUND_APP_ADJ = 0;
+
+// This is a process that the system or a persistent process has bound to,
+// and indicated it is important.
+static final int PERSISTENT_SERVICE_ADJ = -700;
+
+// This is a system persistent process, such as telephony. Definitely
+// don't want to kill it, but doing so is not completely fatal.
+static final int PERSISTENT_PROC_ADJ = -800;
+
+// The system process runs at the default adjustment.
+static final int SYSTEM_ADJ = -900;
+
+// Special code for native processes that are not being managed by the system (so
+// don't have an oom adj assigned by the system).
+static final int NATIVE_ADJ = -1000;
+```
+
+[man-proc]: https://manpages.debian.org/stretch/manpages/proc.5.en.html
diff --git a/docs/data-sources/native-heap-profiler.md b/docs/data-sources/native-heap-profiler.md
new file mode 100644
index 0000000..dc81a15
--- /dev/null
+++ b/docs/data-sources/native-heap-profiler.md
@@ -0,0 +1,488 @@
+# Native heap profiler
+
+NOTE: **heapprofd requires Android 10 or higher**
+
+Heapprofd is a tool that tracks native heap allocations & deallocations of an
+Android process within a given time period. The resulting profile can be used to
+attribute memory usage to particular call-stacks, supporting a mix of both
+native and java code. The tool can be used by Android platform and app
+developers to investigate memory issues.
+
+On debug Android builds, you can profile all apps and most system services.
+On "user" builds, you can only use it on apps with the debuggable or
+profileable manifest flag.
+
+## Quickstart
+
+See the [Memory Guide](/docs/case-studies/memory.md#heapprofd) for getting
+started with heapprofd.
+
+## UI
+
+Dumps from heapprofd are shown as flamegraphs in the UI after clicking on the
+diamond. Each diamond corresponds to a snapshot of the allocations and
+callstacks collected at that point in time.
+
+
+
+
+
+## SQL
+
+Information about callstacks is written to the following tables:
+
+* [`stack_profile_mapping`](/docs/analysis/sql-tables.autogen#stack_profile_mapping)
+* [`stack_profile_frame`](/docs/analysis/sql-tables.autogen#stack_profile_frame)
+* [`stack_profile_callsite`](/docs/analysis/sql-tables.autogen#stack_profile_callsite)
+
+The allocations themselves are written to
+[`heap_profile_allocation`](/docs/analysis/sql-tables.autogen#heap_profile_allocation).
+
+Offline symbolization data is stored in
+[`stack_profile_symbol`](/docs/analysis/sql-tables.autogen#stack_profile_symbol).
+
+See [Example Queries](#heapprofd-example-queries) for example SQL queries.
+
+## Recording
+
+Heapprofd can be configured and started in three ways.
+
+#### Manual configuration
+
+This requires manually setting the
+[HeapprofdConfig](/docs/reference/trace-config-proto.autogen#HeapprofdConfig)
+section of the trace config. The only benefit of doing so is that in this way
+heap profiling can be enabled alongside any other tracing data sources.
+
+#### Using the tools/heap_profile script (recommended)
+
+On Linux / MacOS, use the `tools/heap_profile` script. If you are having trouble
+make sure you are using the
+[latest version](
+https://raw.githubusercontent.com/google/perfetto/master/tools/heap_profile).
+
+You can target processes either by name (`-n com.example.myapp`) or by PID
+(`-p 1234`). In the first case, the heap profile will be initiated on both on
+already-running processes that match the package name and new processes launched
+after the profiling session is started.
+For the full arguments list see the
+[heap_profile cmdline reference page](/docs/reference/heap_profile-cli).
+
+#### Using the Recording page of Perfetto UI
+
+You can also use the [Perfetto UI](https://ui.perfetto.dev/#!/record?p=memory)
+to record heapprofd profiles. Tick "Heap profiling" in the trace configuration,
+enter the processes you want to target, click "Add Device" to pair your phone,
+and record profiles straight from your browser. This is also possible on
+Windows.
+
+## Viewing the data
+
+The resulting profile proto contains four views on the data
+
+* **space**: how many bytes were allocated but not freed at this callstack the
+ moment the dump was created.
+* **alloc\_space**: how many bytes were allocated (including ones freed at the
+ moment of the dump) at this callstack
+* **objects**: how many allocations without matching frees were done at this
+ callstack.
+* **alloc\_objects**: how many allocations (including ones with matching frees)
+ were done at this callstack.
+
+_(Googlers: You can also open the gzipped protos using http://pprof/)_
+
+TIP: you might want to put `libart.so` as a "Hide regex" when profiling apps.
+
+You can use the [Perfetto UI](https://ui.perfetto.dev) to visualize heap dumps.
+Upload the `raw-trace` file in your output directory. You will see all heap
+dumps as diamonds on the timeline, click any of them to get a flamegraph.
+
+Alternatively [Speedscope](https://speedscope.app) can be used to visualize
+the gzipped protos, but will only show the space view.
+
+TIP: Click Left Heavy on the top left for a good visualization.
+
+## Sampling interval
+
+Heapprofd samples heap allocations by hooking calls to malloc/free and C++'s
+operator new/delete. Given a sampling interval of n bytes, one allocation is
+sampled, on average, every n bytes allocated. This allows to reduce the
+performance impact on the target process. The default sampling rate
+is 4096 bytes.
+
+The easiest way to reason about this is to imagine the memory allocations as a
+stream of one byte allocations. From this stream, every byte has a 1/n
+probability of being selected as a sample, and the corresponding callstack
+gets attributed the complete n bytes. For more accuracy, allocations larger than
+the sampling interval bypass the sampling logic and are recorded with their true
+size.
+
+## Startup profiling
+
+When specifying a target process name (as opposite to the PID), new processes
+matching that name are profiled from their startup. The resulting profile will
+contain all allocations done between the start of the process and the end
+of the profiling session.
+
+On Android, Java apps are usually not exec()-ed from scratch, but fork()-ed from
+the [zygote], which then specializes into the desired app. If the app's name
+matches a name specified in the profiling session, profiling will be enabled as
+part of the zygote specialization. The resulting profile contains all
+allocations done between that point in zygote specialization and the end of the
+profiling session. Some allocations done early in the specialization process are
+not accounted for.
+
+At the trace proto level, the resulting [ProfilePacket] will have the
+`from_startup` field set to true in the corresponding `ProcessHeapSamples`
+message. This is not surfaced in the converted pprof compatible proto.
+
+[ProfilePacket]: /docs/reference/trace-packet-proto.autogen#ProfilePacket
+[zygote]: https://developer.android.com/topic/performance/memory-overview#SharingRAM
+
+## Runtime profiling
+
+When a profiling session is started, all matching processes (by name or PID)
+are enumerated and profiling is enabled. The resulting profile will contain
+all allocations done between the beginning and the end of the profiling
+session.
+
+The resulting [ProfilePacket] will have `from_startup` set to false in the
+corresponding `ProcessHeapSamples` message. This does not get surfaced in the
+converted pprof compatible proto.
+
+## Concurrent profiling sessions
+
+If multiple sessions name the same target process (either by name or PID),
+only the first relevant session will profile the process. The other sessions
+will report that the process had already been profiled when converting to
+the pprof compatible proto.
+
+If you see this message but do not expect any other sessions, run
+
+```shell
+adb shell killall perfetto
+```
+
+to stop any concurrent sessions that may be running.
+
+The resulting [ProfilePacket] will have `rejected_concurrent` set to true in
+otherwise empty corresponding `ProcessHeapSamples` message. This does not get
+surfaced in the converted pprof compatible proto.
+
+## {#heapprofd-targets} Target processes
+
+Depending on the build of Android that heapprofd is run on, some processes
+are not be eligible to be profiled.
+
+On _user_ (i.e. production, non-rootable) builds, only Java applications with
+either the profileable or the debuggable manifest flag set can be profiled.
+Profiling requests for non-profileable/debuggable processes will result in an
+empty profile.
+
+On userdebug builds, all processes except for a small blacklist of critical
+services can be profiled (to find the blacklist, look for
+`never_profile_heap` in [heapprofd.te](
+https://cs.android.com/android/platform/superproject/+/master:system/sepolicy/private/heapprofd.te?q=never_profile_heap).
+This restriction can be lifted by disabling SELinux by running
+`adb shell su root setenforce 0` or by passing `--disable-selinux` to the
+`heap_profile` script.
+
+<center>
+
+| | userdebug setenforce 0 | userdebug | user |
+|-------------------------|:----------------------:|:---------:|:----:|
+| critical native service | Y | N | N |
+| native service | Y | Y | N |
+| app | Y | Y | N |
+| profileable app | Y | Y | Y |
+| debuggable app | Y | Y | Y |
+
+</center>
+
+To mark an app as profileable, put `<profileable android:shell="true"/>` into
+the `<application>` section of the app manifest.
+
+```xml
+<manifest ...>
+ <application>
+ <profileable android:shell="true"/>
+ ...
+ </application>
+</manifest>
+```
+
+## DEDUPED frames
+
+If the name of a Java method includes `[DEDUPED]`, this means that multiple
+methods share the same code. ART only stores the name of a single one in its
+metadata, which is displayed here. This is not necessarily the one that was
+called.
+
+## Triggering heap snapshots on demand
+
+Heap snapshot are recorded into the trace either at regular time intervals, if
+using the `continuous_dump_config` field, or at the end of the session.
+
+You can also trigger a snapshot of all currently profiled processes by running
+`adb shell killall -USR1 heapprofd`. This can be useful in lab tests for
+recording the current memory usage of the target in a specific state.
+
+This dump will show up in addition to the dump at the end of the profile that is
+always produced. You can create multiple of these dumps, and they will be
+enumerated in the output directory.
+
+## Symbolization
+
+NOTE: Symbolization is currently only available on Linux
+
+### Set up llvm-symbolizer
+
+You only need to do this once.
+
+To use symbolization, your system must have llvm-symbolizer installed and
+accessible from `$PATH` as `llvm-symbolizer`. On Debian, you can install it
+using `sudo apt install llvm-9`.
+This will create `/usr/bin/llvm-symbolizer-9`. Symlink that to somewhere in
+your `$PATH` as `llvm-symbolizer`.
+
+For instance, `ln -s /usr/bin/llvm-symbolizer-9 ~/bin/llvm-symbolizer`, and
+add `~/bin` to your path (or run the commands below with `PATH=~/bin:$PATH`
+prefixed).
+
+### Symbolize your profile
+
+If the profiled binary or libraries do not have symbol names, you can
+symbolize profiles offline. Even if they do, you might want to symbolize in
+order to get inlined function and line number information. All tools
+(traceconv, trace_processor_shell, the heap_profile script) support specifying
+the `PERFETTO_BINARY_PATH` as an environment variable.
+
+```
+PERFETTO_BINARY_PATH=somedir tools/heap_profile --name ${NAME}
+```
+
+You can persist symbols for a trace by running
+`PERFETTO_BINARY_PATH=somedir tools/traceconv symbolize raw-trace > symbols`.
+You can then concatenate the symbols to the trace (
+`cat raw-trace symbols > symbolized-trace`) and the symbols will part of
+`symbolized-trace`. The `tools/heap_profile` script will also generate this
+file in your output directory, if `PERFETTO_BINARY_PATH` is used.
+
+The symbol file is the first with matching Build ID in the following order:
+
+1. absolute path of library file relative to binary path.
+2. absolute path of library file relative to binary path, but with base.apk!
+ removed from filename.
+3. basename of library file relative to binary path.
+4. basename of library file relative to binary path, but with base.apk!
+ removed from filename.
+5. in the subdirectory .build-id: the first two hex digits of the build-id
+ as subdirectory, then the rest of the hex digits, with ".debug"appended.
+ See
+ https://fedoraproject.org/wiki/RolandMcGrath/BuildID#Find_files_by_build_ID
+
+For example, "/system/lib/base.apk!foo.so" with build id abcd1234,
+is looked for at:
+
+1. $PERFETTO_BINARY_PATH/system/lib/base.apk!foo.so
+2. $PERFETTO_BINARY_PATH/system/lib/foo.so
+3. $PERFETTO_BINARY_PATH/base.apk!foo.so
+4. $PERFETTO_BINARY_PATH/foo.so
+5. $PERFETTO_BINARY_PATH/.build-id/ab/cd1234.debug
+
+## Troubleshooting
+
+### Buffer overrun
+
+If the rate of allocations is too high for heapprofd to keep up, the profiling
+session will end early due to a buffer overrun. If the buffer overrun is
+caused by a transient spike in allocations, increasing the shared memory buffer
+size (passing `--shmem-size` to `tools/heap_profile`) can resolve the issue.
+Otherwise the sampling interval can be increased (at the expense of lower
+accuracy in the resulting profile) by passing `--interval=16000` or higher.
+
+### Profile is empty
+
+Check whether your target process is eligible to be profiled by consulting
+[Target processes](#target-processes) above.
+
+Also check the [Known Issues](#known-issues).
+
+### Implausible callstacks
+
+If you see a callstack that seems to impossible from looking at the code, make
+sure no [DEDUPED frames](#deduped-frames) are involved.
+
+Also, if your code is linked using _Identical Code Folding_
+(ICF), i.e. passing `-Wl,--icf=...` to the linker, most trivial functions, often
+constructors and destructors, can be aliased to binary-equivalent operators
+of completely unrelated classes.
+
+### Symbolization: Could not find library
+
+When symbolizing a profile, you might come across messages like this:
+
+```bash
+Could not find /data/app/invalid.app-wFgo3GRaod02wSvPZQ==/lib/arm64/somelib.so
+(Build ID: 44b7138abd5957b8d0a56ce86216d478).
+```
+
+Check whether your library (in this example somelib.so) exists in
+`PERFETTO_BINARY_PATH`. Then compare the Build ID to the one in your
+symbol file, which you can get by running
+`readelf -n /path/in/binary/path/somelib.so`. If it does not match, the
+symbolized file has a different version than the one on device, and cannot
+be used for symbolization.
+If it does, try moving somelib.so to the root of `PERFETTO_BINARY_PATH` and
+try again.
+
+### Only one frame shown
+If you only see a single frame for functions in a specific library, make sure
+that the library has unwind information. We need one of
+
+* `.gnu_debugdata`
+* `.eh_frame` (+ preferably `.eh_frame_hdr`)
+* `.debug_frame`.
+
+Frame-pointer unwinding is *not supported*.
+
+To check if an ELF file has any of those, run
+
+```console
+$ readelf -S file.so | grep "gnu_debugdata\|eh_frame\|debug_frame"
+ [12] .eh_frame_hdr PROGBITS 000000000000c2b0 0000c2b0
+ [13] .eh_frame PROGBITS 0000000000011000 00011000
+ [24] .gnu_debugdata PROGBITS 0000000000000000 000f7292
+```
+
+If this does not show one or more of the sections, change your build system
+to not strip them.
+
+## Known Issues
+
+### Android 10
+
+* On ARM32, the bottom-most frame is always `ERROR 2`. This is harmless and
+ the callstacks are still complete.
+* x86 platforms are not supported. This includes the Android _Cuttlefish_
+ emulator.
+* If heapprofd is run standalone (by running `heapprofd` in a root shell, rather
+ than through init), `/dev/socket/heapprofd` get assigned an incorrect SELinux
+ domain. You will not be able to profile any processes unless you disable
+ SELinux enforcement.
+ Run `restorecon /dev/socket/heapprofd` in a root shell to resolve.
+
+## Heapprofd vs malloc_info() vs RSS
+
+When using heapprofd and interpreting results, it is important to know the
+precise meaning of the different memory metrics that can be obtained from the
+operating system.
+
+**heapprofd** gives you the number of bytes the target program
+requested from the default C/C++ allocator. If you are profiling a Java app from
+startup, allocations that happen early in the application's initialization will
+not be visible to heapprofd. Native services that do not fork from the Zygote
+are not affected by this.
+
+**malloc\_info** is a libc function that gives you information about the
+allocator. This can be triggered on userdebug builds by using
+`am dumpheap -m <PID> /data/local/tmp/heap.txt`. This will in general be more
+than the memory seen by heapprofd, depending on the allocator not all memory
+is immediately freed. In particular, jemalloc retains some freed memory in
+thread caches.
+
+**Heap RSS** is the amount of memory requested from the operating system by the
+allocator. This is larger than the previous two numbers because memory can only
+be obtained in page size chunks, and fragmentation causes some of that memory to
+be wasted. This can be obtained by running `adb shell dumpsys meminfo <PID>` and
+looking at the "Private Dirty" column.
+RSS can also end up being smaller than the other two if the device kernel uses
+memory compression (ZRAM, enabled by default on recent versions of android) and
+the memory of the process get swapped out onto ZRAM.
+
+| | heapprofd | malloc\_info | RSS |
+|---------------------|:-----------------:|:------------:|:---:|
+| from native startup | x | x | x |
+| after zygote init | x | x | x |
+| before zygote init | | x | x |
+| thread caches | | x | x |
+| fragmentation | | | x |
+
+If you observe high RSS or malloc\_info metrics but heapprofd does not match,
+you might be hitting some patological fragmentation problem in the allocator.
+
+## Convert to pprof
+
+You can use [traceconv](/docs/quickstart/traceconv.md) to convert the heap dumps
+in a trace into the [pprof](https://github.com/google/pprof) format. These can
+then be viewed using the pprof CLI or a UI (e.g. Speedscope, or Google-internal
+pprof/).
+
+```bash
+tools/traceconv profile /tmp/profile
+```
+
+This will create a directory in `/tmp/` containing the heap dumps. Run:
+
+```bash
+gzip /tmp/heap_profile-XXXXXX/*.pb
+```
+
+to get gzipped protos, which tools handling pprof profile protos expect.
+
+## {#heapprofd-example-queries} Example SQL Queries
+
+We can get the callstacks that allocated using an SQL Query in the
+Trace Processor. For each frame, we get one row for the number of allocated
+bytes, where `count` and `size` is positive, and, if any of them were already
+freed, another line with negative `count` and `size`. The sum of those gets us
+the `space` view.
+
+```sql
+select a.callsite_id, a.ts, a.upid, f.name, f.rel_pc, m.build_id, m.name as mapping_name,
+ sum(a.size) as space_size, sum(a.count) as space_count
+ from heap_profile_allocation a join
+ stack_profile_callsite c ON (a.callsite_id = c.id) join
+ stack_profile_frame f ON (c.frame_id = f.id) join
+ stack_profile_mapping m ON (f.mapping = m.id)
+ group by 1, 2, 3, 4, 5, 6, 7 order by space_size desc;
+```
+
+| callsite_id | ts | upid | name | rel_pc | build_id | mapping_name | space_size | space_count |
+|-------------|----|------|-------|-----------|------|--------|----------|------|
+|6660|5|1| malloc |244716| 8126fd.. | /apex/com.android.runtime/lib64/bionic/libc.so |106496|4|
+|192 |5|1| malloc |244716| 8126fd.. | /apex/com.android.runtime/lib64/bionic/libc.so |26624 |1|
+|1421|5|1| malloc |244716| 8126fd.. | /apex/com.android.runtime/lib64/bionic/libc.so |26624 |1|
+|1537|5|1| malloc |244716| 8126fd.. | /apex/com.android.runtime/lib64/bionic/libc.so |26624 |1|
+|8843|5|1| malloc |244716| 8126fd.. | /apex/com.android.runtime/lib64/bionic/libc.so |26424 |1|
+|8618|5|1| malloc |244716| 8126fd.. | /apex/com.android.runtime/lib64/bionic/libc.so |24576 |4|
+|3750|5|1| malloc |244716| 8126fd.. | /apex/com.android.runtime/lib64/bionic/libc.so |12288 |1|
+|2820|5|1| malloc |244716| 8126fd.. | /apex/com.android.runtime/lib64/bionic/libc.so |8192 |2|
+|3788|5|1| malloc |244716| 8126fd.. | /apex/com.android.runtime/lib64/bionic/libc.so |8192 |2|
+
+We can see all the functions are "malloc" and "realloc", which is not terribly
+informative. Usually we are interested in the _cumulative_ bytes allocated in
+a function (otherwise, we will always only see malloc / realloc). Chasing the
+parent_id of a callsite (not shown in this table) recursively is very hard in
+SQL.
+
+There is an **experimental** table that surfaces this information. The **API is
+subject to change**.
+
+```sql
+select name, map_name, cumulative_size
+ from experimental_flamegraph(8300973884377,1,'native')
+ order by abs(cumulative_size) desc;
+```
+
+| name | map_name | cumulative_size |
+|------|----------|----------------|
+|__start_thread|/apex/com.android.runtime/lib64/bionic/libc.so|392608|
+|_ZL15__pthread_startPv|/apex/com.android.runtime/lib64/bionic/libc.so|392608|
+|_ZN13thread_data_t10trampolineEPKS|/system/lib64/libutils.so|199496|
+|_ZN7android14AndroidRuntime15javaThreadShellEPv|/system/lib64/libandroid_runtime.so|199496|
+|_ZN7android6Thread11_threadLoopEPv|/system/lib64/libutils.so|199496|
+|_ZN3art6Thread14CreateCallbackEPv|/apex/com.android.art/lib64/libart.so|193112|
+|_ZN3art35InvokeVirtualOrInterface...|/apex/com.android.art/lib64/libart.so|193112|
+|_ZN3art9ArtMethod6InvokeEPNS_6ThreadEPjjPNS_6JValueEPKc|/apex/com.android.art/lib64/libart.so|193112|
+|art_quick_invoke_stub|/apex/com.android.art/lib64/libart.so|193112|
diff --git a/docs/data-sources/syscalls.md b/docs/data-sources/syscalls.md
new file mode 100644
index 0000000..3e6156d
--- /dev/null
+++ b/docs/data-sources/syscalls.md
@@ -0,0 +1,54 @@
+# System calls
+
+On Linux and Android (userdebug builds only) Perfetto can keep track of system
+calls.
+
+Right now only the syscall number is recorded in the trace, the arguments are
+not stored to limit the trace size overhead.
+
+At import time, the Trace Processor uses an internal syscall mapping table,
+currently supporting x86, x86_64, ArmEabi, aarch32 and aarch64. These tables are
+generated through the
+[`extract_linux_syscall_tables`](/tools/extract_linux_syscall_tables) script.
+
+## UI
+
+At the UI level system calls are shown inlined with the per-thread slice tracks:
+
+
+
+## SQL
+
+At the SQL level, syscalls are no different than any other userspace slice
+event. They get interleaved in the per-thread slice stack and can be easily
+filtered by looking for the 'sys_' prefix:
+
+```sql
+select ts, dur, t.name as thread, s.name, depth from slices as s
+left join thread_track as tt on s.track_id = tt.id
+left join thread as t on tt.utid = t.utid
+where s.name like 'sys_%'
+```
+
+ts | dur | thread | name
+---|-----|--------|------
+856325324372751 | 439867648 | s.nexuslauncher | sys_epoll_pwait
+856325324376970 | 990 | FpsThrottlerThr | sys_recvfrom
+856325324378376 | 2657 | surfaceflinger | sys_ioctl
+856325324419574 | 1250 | android.anim.lf | sys_recvfrom
+856325324428168 | 27344 | android.anim.lf | sys_ioctl
+856325324451345 | 573 | FpsThrottlerThr | sys_getuid
+
+## TraceConfig
+
+```protobuf
+data_sources: {
+ config {
+ name: "linux.ftrace"
+ ftrace_config {
+ ftrace_events: "raw_syscalls/sys_enter"
+ ftrace_events: "raw_syscalls/sys_exit"
+ }
+ }
+}
+```
diff --git a/docs/data-sources/system-log.md b/docs/data-sources/system-log.md
new file mode 100644
index 0000000..73d30c9
--- /dev/null
+++ b/docs/data-sources/system-log.md
@@ -0,0 +1,108 @@
+## Syscalls
+The enter and exit of all syscalls can be tracked in Perfetto traces.
+
+
+The following ftrace events need to added to the trace config to collect syscalls.
+
+```protobuf
+data_sources: {
+ config {
+ name: "linux.ftrace"
+ ftrace_config {
+ ftrace_events: "raw_syscalls/sys_enter"
+ ftrace_events: "raw_syscalls/sys_exit"
+ }
+ }
+}
+```
+
+## Linux kernel tracing
+Perfetto integrates with [Linux kernel event tracing](https://www.kernel.org/doc/Documentation/trace/ftrace.txt).
+While Perfetto has special support for some events (for example see [CPU Scheduling](#cpu-scheduling)) Perfetto can collect arbitrary events.
+This config collects four Linux kernel events:
+
+```protobuf
+data_sources {
+ config {
+ name: "linux.ftrace"
+ ftrace_config {
+ ftrace_events: "ftrace/print"
+ ftrace_events: "sched/sched_switch"
+ ftrace_events: "task/task_newtask"
+ ftrace_events: "task/task_rename"
+ }
+ }
+}
+```
+
+A wildcard can be used to collect all events in a category:
+
+```protobuf
+data_sources {
+ config {
+ name: "linux.ftrace"
+ ftrace_config {
+ ftrace_events: "ftrace/print"
+ ftrace_events: "sched/*"
+ }
+ }
+}
+```
+
+The full configuration options for ftrace can be seen in [ftrace_config.proto](/protos/perfetto/config/ftrace/ftrace_config.proto).
+
+## Android system logs
+
+### Android logcat
+Include Android Logcat messages in the trace and view them in conjunction with other trace data.
+
+
+
+You can configure which log buffers are included in the trace. If no buffers are specified, all will be included.
+
+```protobuf
+data_sources: {
+ config {
+ name: "android.log"
+ android_log_config {
+ log_ids: LID_DEFAULT
+ log_ids: LID_SYSTEM
+ log_ids: LID_CRASH
+ }
+ }
+}
+```
+
+You may also want to add filtering on a tags using the `filter_tags` parameter or set a min priority to be included in the trace using `min_prio`.
+For details about configuration options, see [android\_log\_config.proto](/protos/perfetto/config/android/android_log_config.proto).
+
+The logs can be investigated along with other information in the trace using the [Perfetto UI](https://ui.perfetto.dev) as shown in the screenshot above.
+
+If using the `trace_processor`, these logs will be in the [android\_logs](/docs/analysis/sql-tables.autogen#android_logs) table. To look at the logs with the tag ‘perfetto’ you would use the following query:
+
+```sql
+select * from android_logs where tag = "perfetto" order by ts
+```
+
+### Android application tracing
+You can enable atrace through Perfetto.
+
+
+
+Add required categories to `atrace_categories` and set `atrace_apps` to a specific app to collect userspace annotations from that app.
+
+```protobuf
+data_sources: {
+ config {
+ name: "linux.ftrace"
+ ftrace_config {
+ atrace_categories: "view"
+ atrace_categories: "webview"
+ atrace_categories: "wm"
+ atrace_categories: "am"
+ atrace_categories: "sm"
+ atrace_apps: "com.android.phone"
+ }
+ }
+}
+```
\ No newline at end of file
diff --git a/docs/design-docs/api-and-abi.md b/docs/design-docs/api-and-abi.md
new file mode 100644
index 0000000..2c8a6b6
--- /dev/null
+++ b/docs/design-docs/api-and-abi.md
@@ -0,0 +1,526 @@
+# Tracing API and ABI: surfaces and stability
+
+This document describes the API and ABI surface of the
+[Perfetto Client Library][cli_lib], what can be expected to be stable long-term
+and what not.
+
+#### In summary
+
+* The public C++ API in `include/perfetto/tracing/` is mostly stable but can
+ occasionally break at compile-time throughout 2020.
+* The C++ API within `include/perfetto/ext/` is internal-only and exposed only
+ for Chromium.
+* The tracing protocol ABI is based on protobuf-over-UNIX-socket and shared
+ memory. It is long-term stable and maintains compatibility in both directions
+ (old service + newer client and vice-versa).
+* The [DataSourceDescriptor][data_source_descriptor.proto],
+ [DataSourceConfig][data_source_config.proto] and
+ [TracePacket][trace-packet-ref] protos are updated maintaining backwards
+ compatibility unless a message is marked as experimental. Trace Processor
+ deals with importing older trace formats.
+* There isn't a version number neither in the trace file nor in the tracing
+ protocol and there will never be one. Feature flags are used when necessary.
+
+## C++ API
+
+The Client Library C++ API allows an app to contribute to the trace with custom
+trace events. Its headers live under [`include/perfetto/`](/include/perfetto).
+
+There are three different tiers of this API, offering increasingly higher
+expressive power, at the cost of increased complexity. The three tiers are built
+on top of each other. (Googlers, for more details see also
+[go/perfetto-client-api](http://go/perfetto-client-api)).
+
+
+
+### Track Event (public)
+
+This mainly consists of the `TRACE_EVENT*` macros defined in
+[`track_event.h`](/include/perfetto/tracing/track_event.h).
+Those macros provide apps with a quick and easy way to add common types of
+instrumentation points (slices, counters, instant events).
+For details and instructions see the [Client Library doc][cli_lib].
+
+### Custom Data Sources (public)
+
+This consists of the `perfetto::DataSource` base class and the
+`perfetto::Tracing` controller class defined in
+[`tracing.h`](/include/perfetto/tracing.h).
+These classes allow an app to create custom data sources which can get
+notifications about tracing sessions lifecycle and emit custom protos in the
+trace (e.g. memory snapshots, compositor layers, etc).
+
+For details and instructions see the [Client Library doc][cli_lib].
+
+Both the Track Event API and the custom data source are meant to be a public
+API.
+
+WARNING: The team is still iterating on this API surface. While we try to avoid
+ deliberate breakages, some occasional compile-time breakages might be
+ encountered when updating the library. The interface is expected to
+ stabilize by the end of 2020.
+
+### Producer / Consumer API (internal)
+
+This consists of all the interfaces defined in the
+[`include/perfetto/ext`](/include/perfetto/ext) directory. These provide access
+to the lowest levels of the Perfetto internals (manually registering producers
+and data sources, handling all IPCs).
+
+These interfaces will always be highly unstable. We highly discourage
+any project from depending on this API because it is too complex and extremely
+hard to get right.
+This API surface exists only for the Chromium project, which has unique
+challenges (e.g., its own IPC system, complex sandboxing models) and has dozens
+of subtle use cases accumulated through over ten years of legacy of
+chrome://tracing. The team is continuously reshaping this surface to gradually
+migrate all Chrome Tracing use cases over to Perfetto.
+
+## Tracing Protocol ABI
+
+The Tracing Protocol ABI consists of the following binary interfaces that allow
+various processes in the operating system to contribute to tracing sessions and
+inject tracing data into the tracing service:
+
+ * [Socket protocol](#socket-protocol)
+ * [Shared memory layout](#shmem-abi)
+ * [Protobuf messages](#protos)
+
+The whole tracing protocol ABI is binary stable across platforms and is updated
+maintaining both backwards and forward compatibility. No breaking changes
+have been introduced since its first revision in Android 9 (Pie, 2018).
+See also the [ABI Stability](#abi-stability) section below.
+
+
+
+### {#socket-protocol} Socket protocol
+
+At the lowest level, the tracing protocol is initiated with a UNIX socket of
+type `SOCK_STREAM` to the tracing service.
+The tracing service listens on two distinct sockets: producer and consumer.
+
+
+
+Both sockets use the same wire protocol, the `IPCFrame` message defined in
+[wire_protocol.proto](/protos/perfetto/ipc/wire_protocol.proto). The wire
+protocol is simply based on a sequence of length-prefixed messages of the form:
+```
+< 4 bytes len little-endian > < proto-encoded IPCFrame >
+
+04 00 00 00 A0 A1 A2 A3 05 00 00 00 B0 B1 B2 B3 B4 ...
+{ len: 4 } [ Frame 1 ] { len: 5 } [ Frame 2 ]
+```
+
+The `IPCFrame` proto message defines a request/response protocol that is
+compatible with the [protobuf services syntax][proto_rpc]. `IPCFrame` defines
+the following frame types:
+
+1. `BindService {producer, consumer} -> service`<br>
+ Binds to one of the two service ports (either `producer_port` or
+ `consumer_port`).
+
+2. `BindServiceReply service -> {producer, consumer}`<br>
+ Replies to the bind request, listing all the RPC methods available, together
+ with their method ID.
+
+3. `InvokeMethod {producer, consumer} -> service`<br>
+ Invokes a RPC method, identified by the ID returned by `BindServiceReply`.
+ The invocation takes as unique argument a proto sub-message. Each method
+ defines a pair of _request_ and _response_ method types.<br>
+ For instance the `RegisterDataSource` defined in [producer_port.proto] takes
+ a `perfetto.protos.RegisterDataSourceRequest` and returns a
+ `perfetto.protos.RegisterDataSourceResponse`.
+
+4. `InvokeMethodReply service -> {producer, consumer}`<br>
+ Returns the result of the corresponding invocation or an error flag.
+ If a method return signature is marked as `stream` (e.g.
+ `returns (stream GetAsyncCommandResponse)`), the method invocation can be
+ followed by more than one `InvokeMethodReply`, all with the same
+ `request_id`. All replies in the stream but the last one will have
+ `has_more: true`, to notify the client more responses for the same invocation
+ will follow.
+
+Here is how the traffic over the IPC socket looks like:
+
+```
+# [Prd > Svc] Bind request for the remote service named "producer_port"
+request_id: 1
+msg_bind_service { service_name: "producer_port" }
+
+# [Svc > Prd] Service reply.
+request_id: 1
+msg_bind_service_reply: {
+ success: true
+ service_id: 42
+ methods: {id: 2; name: "InitializeConnection" }
+ methods: {id: 5; name: "RegisterDataSource" }
+ methods: {id: 3; name: "UnregisterDataSource" }
+ ...
+}
+
+# [Prd > Svc] Method invocation (RegisterDataSource)
+request_id: 2
+msg_invoke_method: {
+ service_id: 42 # "producer_port"
+ method_id: 5 # "RegisterDataSource"
+
+ # Proto-encoded bytes for the RegisterDataSourceRequest message.
+ args_proto: [XX XX XX XX]
+}
+
+# [Svc > Prd] Result of RegisterDataSource method invocation.
+request_id: 2
+msg_invoke_method_reply: {
+ success: true
+ has_more: false # EOF for this request
+
+ # Proto-encoded bytes for the RegisterDataSourceResponse message.
+ reply_proto: [XX XX XX XX]
+}
+```
+
+#### Producer socket
+
+The producer socket exposes the RPC interface defined in [producer_port.proto].
+It allows processes to advertise data sources and their capabilities, receive
+notifications about the tracing session lifecycle (trace being started, stopped)
+and signal trace data commits and flush requests.
+
+This socket is also used by the producer and the service to exchange a
+tmpfs file descriptor during initialization for setting up the
+[shared memory buffer](/docs/concepts/buffers.md) where tracing data will be
+written (asynchronously).
+
+On Android this socket is linked at `/dev/socket/traced_producer`. On all
+platforms it is overridable via the `PERFETTO_PRODUCER_SOCK_NAME` env var.
+
+On Android all apps and most system processes can connect to it
+(see [`perfetto_producer` in SELinux policies][selinux_producer]).
+
+In the Perfetto codebase, the [`traced_probes`](/src/traced/probes/) and
+[`heapprofd`](/src/profiling/memory) processes use the producer socket for
+injecting system-wide tracing / profiling data.
+
+#### Consumer socket
+
+The consumer socket exposes the RPC interface defined in [consumer_port.proto].
+The consumer socket allows processes to control tracing sessions (start / stop
+tracing) and read back trace data.
+
+On Android this socket is linked at `/dev/socket/traced_consumer`. On all
+platforms it is overridable via the `PERFETTO_CONSUMER_SOCK_NAME` env var.
+
+Trace data contains sensitive information that discloses the activity the
+system (e.g., which processes / threads are running) and can allow side-channel
+attacks. For this reason the consumer socket is intended to be exposed only to
+a few privileged processes.
+
+On Android, only the `adb shell` domain (used by various UI tools like
+[Perfetto UI](https://ui.perfetto.dev/),
+[Android Studio](https://developer.android.com/studio) or the
+[Android GPU Inspector](https://github.com/google/agi))
+and few other trusted system services are allowed to access the consumer socket
+(see [traced_consumer in SELinux][selinux_consumer]).
+
+In the Perfetto codebase, the [`perfetto`](/docs/reference/perfetto-cli)
+binary (`/system/bin/perfetto` on Android) provides a consumer implementation
+and exposes it through a command line interface.
+
+#### Socket protocol FAQs
+
+_Why SOCK_STREAM and not DGRAM/SEQPACKET?_
+
+1. To allow direct passthrough of the consumer socket on Android through
+ `adb forward localabstract` and allow host tools to directly talk to the
+ on-device tracing service. Today both the Perfetto UI and Android GPU
+ Inspector do this.
+2. To allow in future to directly control a remote service over TCP or SSH
+ tunneling.
+3. Because the socket buffer for `SOCK_DGRAM` is extremely limited and
+ and `SOCK_SEQPACKET` is not supported on MacOS.
+
+_Why not gRPC?_
+
+The team evaluated gRPC in late 2017 as an alternative but ruled it out
+due to: (i) binary size and memory footprint; (ii) the complexity and overhead
+of running a full HTTP/2 stack over a UNIX socket; (iii) the lack of
+fine-grained control on back-pressure.
+
+_Is the UNIX socket protocol used within Chrome processes?_
+
+No. Within Chrome processes (the browser app, not CrOS) Perfetto doesn't use
+any doesn't use any unix socket. Instead it uses the functionally equivalent
+Mojo endpoints [`Producer{Client,Host}` and `Consumer{Client,Host}`][mojom].
+
+### Shared memory
+
+This section describes the binary interface of the memory buffer shared between
+a producer process and the tracing service (SMB).
+
+The SMB is a staging area to decouple data sources living in the Producer
+and allow them to do non-blocking async writes. A SMB is small-ish, typically
+hundreds of KB. Its size is configurable by the producer when connecting.
+For more architectural details about the SMB see also the
+[buffers and dataflow doc](/docs/concepts/buffers.md) and the
+[shared_memory_abi.h] sources.
+
+#### Obtaining the SMB
+
+The SMB is obtained by passing a tmpfs file descriptor over the producer socket
+and memory-mapping it both from the producer and service.
+The producer specifies the desired SMB size and memory layout when sending the
+[`InitializeConnectionRequest`][producer_port.proto] request to the
+service, which is the very first IPC sent after connection.
+By default, the service creates the SMB and passes back its file descriptor to
+the producer with the the [`InitializeConnectionResponse`][producer_port.proto]
+IPC reply. Recent versions of the service (Android R / 11) allow the FD to be
+created by the producer and passed down to the service in the request. When the
+service supports this, it acks the request setting
+`InitializeConnectionResponse.using_shmem_provided_by_producer = true`. At the
+time of writing this feature is used only by Chrome for dealing with lazy
+Mojo initialization during startup tracing.
+
+#### SMB memory layout: pages, chunks, fragments and packets
+
+The SMB is partitioned into fixed-size pages. A SMB page must be an integer
+multiple of 4KB. The only valid sizes are: 4KB, 8KB, 16KB, 32KB.
+
+The size of a SMB page is determined by each Producer at connection time, via
+the `shared_memory_page_size_hint_bytes` field of `InitializeConnectionRequest`
+and cannot be changed afterwards. All pages in the SMB have the same size,
+constant throughout the lifetime of the producer process.
+
+
+
+**A page** is a fixed-sized partition of the shared memory buffer and is just a
+container of chunks.
+The Producer can partition each Page SMB using a limited number of predetermined
+layouts (1 page : 1 chunk; 1 page : 2 chunks and so on).
+The page layout is stored in a 32-bit atomic word in the page header. The same
+32-bit word contains also the state of each chunk (2 bits per chunk).
+
+Having fixed the total SMB size (hence the total memory overhead), the page
+size is a triangular trade off between:
+
+1. IPC traffic: smaller pages -> more IPCs.
+2. Producer lock freedom: larger pages -> larger chunks -> data sources can
+ write more data without needing to swap chunks and synchronize.
+3. Risk of write-starving the SMB: larger pages -> higher chance that the
+ Service won't manage to drain them and the SMB remains full.
+
+The page size, on the other side, has no implications on memory wasted due to
+fragmentation (see Chunk below).
+
+**A chunk** A chunk is a portion of a Page and contains a linear sequence of
+[`TracePacket(s)`][trace-packet-ref] (the root trace proto).
+
+A Chunk defines the granularity of the interaction between the Producer and
+tracing Service. When a producer fills a chunk it sends `CommitData` IPC to the
+service, asking it to copy its contents into the central non-shared buffers.
+
+A a chunk can be in one of the following four states:
+
+* `Free` : The Chunk is free. The Service shall never touch it, the Producer
+ can acquire it when writing and transition it into the `BeingWritten` state.
+
+* `BeingWritten`: The Chunk is being written by the Producer and is not
+ complete yet (i.e. there is still room to write other trace packets).
+ The Service never alter the state of chunks in the `BeingWritten` state
+ (but will still read them when flushing even if incomplete).
+
+* `Complete`: The Producer is done writing the chunk and won't touch it
+ again. The Service can move it to its non-shared ring buffer and mark the
+ chunk as `BeingRead` -> `Free` when done.
+
+* `BeingRead`: The Service is moving the page into its non-shared ring
+ buffer. Producers never touch chunks in this state.
+ _Note: this state ended up being never used as the service directly
+ transitions chunks from `Complete` back to `Free`_.
+
+A chunk is owned exclusively by one thread of one data source of the producer.
+
+Chunks are essentially single-writer single-thread lock-free arenas. Locking
+happens only when a Chunk is full and a new one needs to be acquired.
+
+Locking happens only within the scope of a Producer process.
+Inter-process locking is not generally allowed. The Producer cannot lock the
+Service and vice versa. In the worst case, any of the two can starve the SMB, by
+marking all chunks as either being read or written. But that has the only side
+effect of losing the trace data.
+The only case when stalling on the writer-side (the Producer) can occur is when
+a data source in a producer opts in into using the
+[`BufferExhaustedPolicy.kStall`](/docs/concepts/buffers.md) policy and the SMB
+is full.
+
+**[TracePacket][trace-packet-ref]** is the atom of tracing. Putting aside
+pages and chunks a trace is conceptually just a concatenation of TracePacket(s).
+A TracePacket can be big (up to 64 MB) and can span across several chunks, hence
+across several pages.
+A TracePacket can therefore be >> chunk size, >> page size and even >> SMB size.
+The Chunk header carries metadata to deal with the TracePacket splitting.
+
+Overview of the Page, Chunk, Fragment and Packet concepts:<br>
+
+
+Memory layout of a Page:<br>
+
+
+Because a packet can be larger than a page, the first and the last packets in
+a chunk can be fragments.
+
+
+
+#### Post-facto patching through IPC
+
+If a TracePacket is particularly large, it is very likely that the chunk that
+contains its initial fragments is committed into the central buffers and removed
+from the SMB by the time the last fragments of the same packets is written.
+
+Nested messages in protobuf are prefixed by their length. In a zero-copy
+direct-serialization scenario like tracing, the length is known only when the
+last field of a submessage is written and cannot be known upfront.
+
+Because of this, it is possible that when the last fragment of a packet is
+written, the writer needs to backfill the size prefix in an earlier fragment,
+which now might have disappeared from the SMB.
+
+In order to do this, the tracing protocol allows to patch the contents of a
+chunk through the `CommitData` IPC (see
+[`CommitDataRequest.ChunkToPatch`][commit_data_request.proto]) after the tracing
+service copied it into the central buffer. There is no guarantee that the
+fragment will be still there (e.g., it can be over-written in ring-buffer mode).
+The service will patch the chunk only if it's still in the buffer and only if
+the producer ID that wrote it matches the Producer ID of the patch request over
+IPC (the Producer ID is not spoofable and is tied to the IPC socket file
+descriptor).
+
+### Proto definitions
+
+The following protobuf messages are part of the overall trace protocol ABI and
+are updated maintaining backward-compatibility, unless marked as experimental
+in the comments.
+
+TIP: See also the _Updating A Message Type_ section of the
+ [Protobuf Language Guide][proto-updating] for valid ABI-compatible changes
+ when updating the schema of a protobuf message.
+
+#### DataSourceDescriptor
+
+Defined in [data_source_descriptor.proto]. This message is sent
+Producer -> Service through IPC on the Producer socket during the Producer
+initialization, before any tracing session is started. This message is used
+to register advertise a data source and its capabilities (e.g., which GPU HW
+counters are supported, their possible sampling rates).
+
+#### DataSourceConfig
+
+Defined in [data_source_config.proto]. This message is sent:
+
+* Consumer -> Service through IPC on the Consumer socket, as part of the
+ [TraceConfig](/docs/concepts/config.md) when a Consumer starts a new tracing
+ session.
+
+* Service -> Producer through IPC on the Producer socket, as a reaction to the
+ above. The service passes through each `DataSourceConfig` section defined in
+ the `TraceConfig` to the corresponding Producer(s) that advertise that data
+ source.
+
+#### TracePacket
+
+Defined in [trace_packet.proto]. This is the root object written by any data
+source into the SMB when producing any form of trace event.
+See the [TracePacket reference][trace-packet-ref] for the full details.
+
+## {#abi-stability} ABI Stability
+
+All the layers of the tracing protocol ABI are long-term stable and can only
+be changed maintaining backwards compatibility.
+
+This is due to the fact that on every Android release the `traced` service
+gets frozen in the system image while unbundled apps (e.g. Chrome) and host
+tools (e.g. Perfetto UI) can be updated at a more frequently cadence.
+
+Both the following scenarios are possible:
+
+#### Producer/Consumer client older than tracing service
+
+This happens typically during Android development. At some point some newer code
+is dropped in the Android platform and shipped to users, while client software
+and host tools will lag behind (or simply the user has not updated their app /
+tools).
+
+The tracing service needs to support clients talking and older version of the
+Producer or Consumer tracing protocol.
+
+* Don't remove IPC methods from the service.
+* Assume that fields added later to existing methods might be absent.
+* For newer Producer/Consumer behaviors, advertise those behaviors through
+ feature flags when connecting to the service. Good examples of this are the
+ `will_notify_on_stop` or `handles_incremental_state_clear` flags in
+ [data_source_descriptor.proto]
+
+#### Producer/Consumer client newer than tracing service
+
+This is the most likely scenario. At some point in 2022 a large number of phones
+will still run Android P or Q, hence running a snapshot of the tracing service
+from ~2018-2020, but will run a recent version Google Chrome.
+Chrome, when configured in system-tracing mode (i.e. system-wide + in-app
+tracing), connects to the Android's `traced` producer socket and talks the
+latest version of the tracing protocol.
+
+The producer/consumer client code needs to be able to talk with an older version of the
+service, which might not support some newer features.
+
+* Newer IPC methods defined in [producer_port.proto] won't exist in the older
+ service. When connecting on the socket the service lists its RPC methods
+ and the client is able to detect if a method is available or not.
+ At the C++ IPC layer, invoking a method that doesn't exist on the service
+ causes the `Deferred<>` promise to be rejected.
+
+* Newer fields in existing IPC methods will just be ignored by the older version
+ of the service.
+
+* If the producer/consumer client depends on a new behavior of the service, and
+ that behavior cannot be inferred by the presence of a method, a new feature
+ flag must be exposed through the `QueryCapabilities` method.
+
+## Static linking vs shared library
+
+The Perfetto Client Library is only available in the form of a static library
+and a single-source amalgamated SDK (which is effectively a static library).
+The library implements the Tracing Protocol ABI so, once statically linked,
+depends only on the socket and shared memory protocol ABI, which are guaranteed
+to be stable.
+
+No shared library distributions are available. We strongly discourage teams from
+attempting to build the tracing library as shared library and use it from a
+different linker unit. It is fine to link AND use the client library within
+the same shared library, as long as none of the perfetto C++ API is exported.
+
+The `PERFETTO_EXPORT` annotations are only used when building the third tier of
+the client library in chromium component builds and cannot be easily repurposed
+for delineating shared library boundaries for the other two API tiers.
+
+This is because the C++ the first two tiers of the Client Library C++ API make
+extensive use of inline headers and C++ templates, in order to allow the
+compiler to see through most of the layers of abstraction.
+
+Maintaining the C++ ABI across hundreds of inlined functions and a shared
+library is prohibitively expensive and too prone to break in extremely subtle
+ways. For this reason the team has ruled out shared library distributions for
+the time being.
+
+[cli_lib]: /docs/instrumentation/tracing-sdk.md
+[selinux_producer]: https://cs.android.com/search?q=perfetto_producer%20f:sepolicy.*%5C.te&sq=
+[selinux_consumer]:https://cs.android.com/search?q=f:sepolicy%2F.*%5C.te%20traced_consumer&sq=
+[mojom]: https://source.chromium.org/chromium/chromium/src/+/master:services/tracing/public/mojom/perfetto_service.mojom?q=producer%20f:%5C.mojom$%20perfetto&ss=chromium&originalUrl=https:%2F%2Fcs.chromium.org%2F
+[proto_rpc]: https://developers.google.com/protocol-buffers/docs/proto#services
+[producer_port.proto]: /protos/perfetto/ipc/producer_port.proto
+[consumer_port.proto]: /protos/perfetto/ipc/consumer_port.proto
+[trace_packet.proto]: /protos/perfetto/trace/trace_packet.proto
+[data_source_descriptor.proto]: /protos/perfetto/common/data_source_descriptor.proto
+[data_source_config.proto]: /protos/perfetto/config/data_source_config.proto
+[trace-packet-ref]: /docs/reference/trace-packet-proto.autogen
+[shared_memory_abi.h]: /include/perfetto/ext/tracing/core/shared_memory_abi.h
+[commit_data_request.proto]: /protos/perfetto/common/commit_data_request.proto
+[proto-updating]: https://developers.google.com/protocol-buffers/docs/proto#updating
diff --git a/docs/continuous-integration.md b/docs/design-docs/continuous-integration.md
similarity index 96%
rename from docs/continuous-integration.md
rename to docs/design-docs/continuous-integration.md
index 024db52..75ebe8c 100644
--- a/docs/continuous-integration.md
+++ b/docs/design-docs/continuous-integration.md
@@ -1,15 +1,15 @@
-# Continuous Integration
+# Perfetto CI design document
-This CI is used on-top (not in replacement of) AOSP's TreeHugger.
+This CI is used on-top of (not in replacement of) AOSP's TreeHugger.
It gives early testing signals and coverage on other OSes and older Android
devices not supported by TreeHugger.
-See the [Testing](testing.md) page for more details about the project testing
-strategy.
+See the [Testing](/docs/contributing/testing.md) page for more details about the
+project testing strategy.
## Architecture diagram
-
+
There are four major components:
@@ -28,7 +28,7 @@
It is based on a background AppEngine service. Such service is only
triggered by deferred tasks and periodic Cron jobs.
-The Controller is the only entity which does authenticated access to Gerrit.
+The Controller is the only entity which performs authenticated access to Gerrit.
It uses a non-privileged gmail account and has no meaningful voting power.
The controller loop does mainly the following:
diff --git a/docs/heapprofd-design.md b/docs/design-docs/heapprofd-design.md
similarity index 96%
rename from docs/heapprofd-design.md
rename to docs/design-docs/heapprofd-design.md
index f5f74cb..1f11bf4 100644
--- a/docs/heapprofd-design.md
+++ b/docs/design-docs/heapprofd-design.md
@@ -7,7 +7,7 @@
Provide a low-overhead native heap profiling mechanism, with C++ and Java callstack attribution, usable by all processes on an Android system. This includes Java and native services. The mechanism is capable of exporting heap dumps into traces in order to be able to correlate heap information with other activity on the system. This feature was added in the Android 10 release.
## Overview
-
+
Implement an out-of-process heap profiler. Do the minimal amount of processing in-line of malloc, and then delegate to a central component for further processing. This introduces a new daemon _heapprofd_.
@@ -31,7 +31,7 @@
**Negligible in-process memory overhead:** the system must not hold bookkeeping data in the process in order not to inflate higher-level metrics like PSS.
-**Bounded performance impact:** the device must still be useable for all use-cases.
+**Bounded performance impact:** the device must still be usable for all use-cases.
## Detailed Design
@@ -42,7 +42,7 @@
One of the real-time signals ([`BIONIC_SIGNAL_PROFILER`](https://cs.android.com/android/platform/superproject/+/master:bionic/libc/platform/bionic/reserved_signals.h?q=symbol:BIONIC_SIGNAL_PROFILER)) is reserved in libc as a triggering mechanism. In this scenario:
* heapprofd sends a RT signal to the target process
-* Upon receival of the signal, bionic reacts by installing a temporary malloc hook, which in turn spawns a thread to dynamically load libheapprofd.so in the process context. This means heapprofd will not work for statically linked binaries, as they lack the abilitity to `dlopen`. We can not spawn the thread directly from the signal handler, as `pthread_create` is not async-safe.
+* Upon receipt of the signal, bionic reacts by installing a temporary malloc hook, which in turn spawns a thread to dynamically load libheapprofd.so in the process context. This means heapprofd will not work for statically linked binaries, as they lack the ability to `dlopen`. We can not spawn the thread directly from the signal handler, as `pthread_create` is not async-safe.
* The initializer in libheapprofd.so is called to take care of the rest (see [client operation](#client-operation-and-in-process-hooks) below)
@@ -74,7 +74,7 @@
### Service operation
-
+
The unwinder thread read the client's shared memory buffers and handle the samples received. The result of the unwinding is then enqueued using a PostTask for the main thread to do the accounting. A queue-based model between the threads is chosen because it makes synchronization easier. No synchronization is needed at all in the main thread, as the bookkeeping data will only be accessed by it.
@@ -158,12 +158,12 @@
<tr>
<td>
-
+
</td>
<td>
-
+
</td>
</tr>
@@ -285,14 +285,14 @@
<tr>
<td>
-
+
<p>
<strong>Mean:</strong> 7000 allocations
</td>
<td>
-
+
<p>
<strong>Mean:</strong> 8950 bytes
diff --git a/docs/heapprofd-wire-protocol.md b/docs/design-docs/heapprofd-wire-protocol.md
similarity index 82%
rename from docs/heapprofd-wire-protocol.md
rename to docs/design-docs/heapprofd-wire-protocol.md
index 65ec187..32d2f1d 100644
--- a/docs/heapprofd-wire-protocol.md
+++ b/docs/design-docs/heapprofd-wire-protocol.md
@@ -12,7 +12,7 @@
## Overview
Instead of using a socket pool for sending callstacks and frees to heapprofd, we use a single shared memory buffer and signaling socket. The client writes the record describing mallocs or frees into the shared memory buffer, and then sends a single byte on the signalling socket to wake up the service.
-
+
## High-level design
Using a shared memory buffer between the client and heapprofd removes the need to drain the socket as fast as possible in the service, which we needed previously to make sure we do not block the client's malloc calls. This allows us to simplify the threading design of heapprofd.
@@ -23,20 +23,20 @@
To shut down a tracing session, the _Main Thread_ posts a task on the corresponding _Unwinding Thread_ to shut down the connection. When the client has disconnected, the _Unwinding Thread_ posts a task on the _Main Thread_ to inform it about the disconnect. The same happens for unexpected disconnects.
-
+
### Ownership
At every point in time, every object is owned by exactly one thread. No references or pointers are shared between different threads.
**_Main Thread:_**
-* Signalling sockets before handshake was completed.
+* Signaling sockets before handshake was completed.
* Bookkeeping data.
* Set of connected processes and TraceConfigs (in `ProcessMatcher` class).
**_Unwinder Thread, for each process:_**
-* Signalling sockets after handshake was completed.
+* Signaling sockets after handshake was completed.
* libunwindstack objects for `/proc/pid/{mem,maps}`.
* Shared memory buffer.
@@ -47,13 +47,13 @@
### 1. Handshake
The _Main Thread_ receives a `TracingConfig` from traced containing a `HeapprofdConfig`. It adds the processes expected to connect, and their `ClientConfiguration` to the `ProcessMatcher`. It then finds matching processes (by PID or cmdline) and sends the heapprofd RT signal to trigger initialization.
-The processes receiving this configuration connect to `/dev/socket/heapprofd` and sends `/proc/self/{map,mem}` fds. The _Main Thread_ finds the matching configuration in the `ProcessMatcher`, creates a new shared memory buffer, and sends the two over the signalling socket. The client uses those to finish initializing its internal state. The _Main Thread_ hands off (`RemoveFiledescriptorWatch` + `AddFiledescriptorWatch`) the signalling socket to an _Unwinding Thread_. It also hands off the `ScopedFile`s for the `/proc` fds. These are used to create `UnwindingMetadata`.
+The processes receiving this configuration connect to `/dev/socket/heapprofd` and sends `/proc/self/{map,mem}` fds. The _Main Thread_ finds the matching configuration in the `ProcessMatcher`, creates a new shared memory buffer, and sends the two over the signaling socket. The client uses those to finish initializing its internal state. The _Main Thread_ hands off (`RemoveFiledescriptorWatch` + `AddFiledescriptorWatch`) the signaling socket to an _Unwinding Thread_. It also hands off the `ScopedFile`s for the `/proc` fds. These are used to create `UnwindingMetadata`.
### 2. Sampling
Now that the handshake is done, all communication is between the _Client_ and its corresponding _Unwinder Thread_.
-For every malloc, the client decides whether to sample the allocation, and if it should, write the `AllocMetadata` + raw stack onto the shared memory buffer, and then sends a byte over the signalling socket to wake up the _Unwinder Thread_. The _Unwinder Thread_ uses `DoUnwind` to get an `AllocRecord` (metadata like size, address, etc + a vector of frames). It then posts a task to the _Main Thread_ to apply this to the bookkeeping.
+For every malloc, the client decides whether to sample the allocation, and if it should, write the `AllocMetadata` + raw stack onto the shared memory buffer, and then sends a byte over the signaling socket to wake up the _Unwinder Thread_. The _Unwinder Thread_ uses `DoUnwind` to get an `AllocRecord` (metadata like size, address, etc + a vector of frames). It then posts a task to the _Main Thread_ to apply this to the bookkeeping.
### 3. Dump / concurrent sampling
@@ -68,15 +68,15 @@
### 4. Disconnect
-traced sends a `StopDataSource` IPC. The _Main Thread_ posts a task to the _Unwinder Thread_ to ask it to disconnect from the client. It unmaps the shared memory, closes the memfd, and then closes the signalling socket.
+traced sends a `StopDataSource` IPC. The _Main Thread_ posts a task to the _Unwinder Thread_ to ask it to disconnect from the client. It unmaps the shared memory, closes the memfd, and then closes the signaling socket.
The client receives an `EPIPE` on the next attempt to send data over that socket, and then tears down the client.
-
+
## Changes to client
-The client will no longer need a socket pool, as all operations are done on the same shared memory buffer and the single signalling socket. Instead, the data is written to the shared memory buffer, and then a single byte is sent on the signalling socket in nonblocking mode.
+The client will no longer need a socket pool, as all operations are done on the same shared memory buffer and the single signaling socket. Instead, the data is written to the shared memory buffer, and then a single byte is sent on the signaling socket in nonblocking mode.
We need to be careful about which operation we use to copy the callstack to the shared memory buffer, as `memcpy(3)` can crash on the stack frame guards due to source hardening.
diff --git a/docs/life-of-a-tracing-session.md b/docs/design-docs/life-of-a-tracing-session.md
similarity index 98%
rename from docs/life-of-a-tracing-session.md
rename to docs/design-docs/life-of-a-tracing-session.md
index be07e02..66690ec 100644
--- a/docs/life-of-a-tracing-session.md
+++ b/docs/design-docs/life-of-a-tracing-session.md
@@ -11,7 +11,7 @@
     default.
 3.  A consumer connects to the tracing service and sets up the IPC channel.
 4.  The consumer starts a tracing session sending a
-    [trace config](trace-config.md) to the service through the
+    [trace config](/docs/concepts/config.md) to the service through the
     [`EnableTracing`](/protos/perfetto/ipc/consumer_port.proto#65) IPC.
 6.  The service creates as many new trace buffers as specified in the config.
 7.  The service iterates through the
diff --git a/docs/design-docs/protozero.md b/docs/design-docs/protozero.md
new file mode 100644
index 0000000..a309912
--- /dev/null
+++ b/docs/design-docs/protozero.md
@@ -0,0 +1,464 @@
+# ProtoZero design document
+
+ProtoZero is a zero-copy zero-alloc zero-syscall protobuf serialization libary
+purposefully built for Perfetto's tracing use cases.
+
+## Motivations
+
+ProtoZero has been designed and optimized for proto serialization, which is used
+by all Perfetto tracing paths.
+Deserialization was introduced only at a later stage of the project and is
+mainly used by offline tools
+(e.g., [TraceProcessor](/docs/analysis/trace-processor.md).
+The _zero-copy zero-alloc zero-syscall_ statement applies only to the
+serialization code.
+
+Perfetto makes extensive use of protobuf in tracing fast-paths. Every trace
+event in Perfetto is a proto
+(see [TracePacket](/docs/reference/trace-packet-proto.autogen) reference). This
+allows events to be strongly typed and makes it easier for the team to maintain
+backwards compatibility using a language that is understood across the board.
+
+Tracing fast-paths need to have very little overhead, because instrumentation
+points are sprinkled all over the codebase of projects like Android
+and Chrome and are performance-critical.
+
+Overhead here is not just defined as CPU time (or instructions retired) it
+takes to execute the instrumentation point. A big source of overhead in a
+tracing system is represented by the working set of the instrumentation points,
+specifically extra I-cache and D-cache misses which would slow down the
+non-tracing code _after_ the tracing instrumentation point.
+
+The major design departures of ProtoZero from canonical C++ protobuf libraries
+like [libprotobuf](https://github.com/google/protobuf) are:
+
+* Treating serialization and deserialization as different use-cases served by
+ different code.
+
+* Optimizing for binary size and working-set-size on the serialization paths.
+
+* Ignoring most of the error checking and long-tail features of protobuf
+ (repeated vs optional, full type checks).
+
+* ProtoZero is not designed as general-purpose protobuf de/serialization and is
+ heavily customized to maintain the tracing writing code minimal and allow the
+ compiler to see through the architectural layers.
+
+* Code generated by ProtoZero needs to be hermetic. When building the
+ amalgamated [Tracing SDK](/docs/instrumentation/tracing-sdk.md), the all
+ perfetto tracing sources need to not have any dependency on any other
+ libraries other than the C++ standard library and C library.
+
+## Usage
+
+At the build-system level, ProtoZero is extremely similar to the conventional
+libprotobuf libray.
+The ProtoZero `.proto -> .pbzero.{cc,h}` compiler is based on top of the
+libprotobuf parser and compiler infrastructure. ProtoZero is as a `protoc`
+compiler plugin.
+
+ProtoZero has a build-time-only dependency on libprotobuf (the plugin depends
+on libprotobuf's parser and compiler). The `.pbzero.{cc,h}` code generated by
+it, however, has no runtime dependency (not even header-only dependencies) on
+libprotobuf.
+
+In order to generate ProtoZero stubs from proto you need to:
+
+1. Build the ProtoZero compiler plugin, which lives in
+ [src/protozero/protoc_plugin/](/src/protozero/protoc_plugin/).
+ ```bash
+ tools/ninja -C out/default protozero_plugin protoc
+ ```
+
+2. Invoke the libprotobuf `protoc` compiler passing the `protozero_plugin`:
+ ```bash
+ out/default/protoc \
+ --plugin=protoc-gen-plugin=out/default/protozero_plugin \
+ --plugin_out=wrapper_namespace=pbzero:/tmp/ \
+ test_msg.proto
+ ```
+ This generates `/tmp/test_msg.pbzero.{cc,h}`.
+
+ NOTE: The .cc file is always empty. ProtoZero-generated code is header only.
+ The .cc file is emitted only because some build systems' rules assume that
+ protobuf codegens generate both a .cc and a .h file.
+
+## Proto serialization
+
+The quickest way to undestand ProtoZero design principles is to start from a
+small example and compare the generated code between libprotobuf and ProtoZero.
+
+```protobuf
+syntax = "proto2";
+
+message TestMsg {
+ optional string str_val = 1;
+ optional int32 int_val = 2;
+ repeated TestMsg nested = 3;
+}
+```
+
+#### libpprotobuf approach
+
+The libprotobuf approach is to generate a C++ class that has one member for each
+proto field, with dedicated serialization and de-serialization methods.
+
+```bash
+out/default/protoc --cpp_out=. test_msg.proto
+```
+
+generates test_msg.pb.{cc,h}. With many degrees of simplification, it looks
+as follows:
+
+```c++
+// This class is generated by the standard protoc compiler in the .pb.h source.
+class TestMsg : public protobuf::MessageLite {
+ private:
+ int32 int_val_;
+ ArenaStringPtr str_val_;
+ RepeatedPtrField<TestMsg> nested_; // Effectively a vector<TestMsg>
+
+ public:
+ const std::string& str_val() const;
+ void set_str_val(const std::string& value);
+
+ bool has_int_val() const;
+ int32_t int_val() const;
+ void set_int_val(int32_t value);
+
+ ::TestMsg* add_nested();
+ ::TestMsg* mutable_nested(int index);
+ const TestMsg& nested(int index);
+
+ std::string SerializeAsString();
+ bool ParseFromString(const std::string&);
+}
+```
+
+The main characteristic of these stubs are:
+
+* Code generated from .proto messages can be used in the codebase as general
+ puropse objects, without ever using the `SerializeAs*()` or `ParseFrom*()`
+ methods (although anecdotal evidence suggests that most project use these
+ proto-generated classes only at the de/serialization endpoints).
+
+* The end-to-end journey of serializing a proto involves two steps:
+ 1. Setting the individual int / string / vector fields of the generated class.
+ 2. Doing a serialization pass over these fields.
+
+ In turn this has side-effects on the code generated. STL copy/assingment
+ operators for strings and vectors are non-trivial because, for instance, they
+ need to deal with dynamic memory resizing.
+
+#### ProtoZero approach
+
+```c++
+// This class is generated by the ProtoZero plugin in the .pbzero.h source.
+class TestMsg : public protozero::Message {
+ public:
+ void set_str_val(const std::string& value) {
+ AppendBytes(/*field_id=*/1, value.data(), value.size());
+ }
+ void set_str_val(const char* data, size_t size) {
+ AppendBytes(/*field_id=*/1, data, size);
+ }
+ void set_int_val(int32_t value) {
+ AppendVarInt(/*field_id=*/2, value);
+ }
+ TestMsg* add_nested() {
+ return BeginNestedMessage<TestMsg>(/*field_id=*/3);
+ }
+}
+```
+
+The ProtoZero-generated stubs are append-only. As the `set_*`, `add_*` methods
+are invoked, the passed arguments are directly serialized into the target
+buffer. This introduces some limitations:
+
+* Readback is not possible: these classes cannot be used as C++ struct
+ replacements.
+
+* No error-checking is performed: nothing prevents a non-repeated field to be
+ emitted twice in the serialized proto if the caller accidentally calls a
+ `set_*()` method twice. Basic type checks are still performed at compile-time
+ though.
+
+* Nested fields must be filled in a stack fashion and cannot be written
+ interleaved. Once a nested message is started, its fields must be set before
+ going back setting the fields of the parent message. This turns out to not be
+ a problem for most tracing use-cases.
+
+This has a number of advantages:
+
+* The classes generated by ProtoZero don't add any extra state on top of the
+ base class they derive (`protozero::Message`). They define only inline
+ setter methods that call base-class serialization methods. Compilers can
+ see through all the inline expansions of these methods.
+
+* As a consequence of that, the binary cost of ProtoZero is independent of the
+ number of protobuf messages defined and their fields, and depends only on the
+ number of `set_*`/`add_*` calls. This (i.e. binary cost of non-used proto
+ messages and fields) anecdotally has been a big issue with libprotobuf.
+
+* The serialization methods don't involve any copy or dynamic allocation. The
+ inline expansion calls directly into the corresponding `AppendVarInt()` /
+ `AppendString()` methods of `protozero::Message`.
+
+* This allows to directly serialize trace events into the
+ [tracing shared memory buffers](/docs/concepts/buffers.md), even if they are
+ not contiguous.
+
+### Scattered buffer writing
+
+A key part of the ProtoZero design is supporting direct serialization on
+non-globally-contiguous sequences of contiguous memory regions.
+
+This happens by decoupling `protozero::Message`, the base class for all the
+generated classes, from the `protozero::ScatteredStreamWriter`.
+The problem it solves is the following: ProtoZero is based on direct
+serialization into shared memory buffers chunks. These chunks are 4KB - 32KB in
+most cases. At the same time, there is no limit in how much data the caller will
+try to write into an individual message, a trace event can be up to 256 MiB big.
+
+
+
+#### Fast-path
+
+At all times the underlying `ScatteredStreamWriter` knows what are the bounds
+of the current buffer. All write operations are bound checked and hit a
+slow-path when crossing the buffer boundary.
+
+Most write operations can be completed within the current buffer boundaries.
+In that case, the cost of a `set_*` operation is in essence a `memcpy()` with
+the extra overhead of var-int encoding for protobuf preambles and
+length-delimited fields.
+
+#### Slow-path
+
+When crossing the boundary, the slow-path asks the
+`ScatteredStreamWriter::Delegate` for a new buffer. The implementation of
+`GetNewBuffer()` is up to the client. In tracing use-cases, that call will
+acquire a new thread-local chunk from the tracing shared memory buffer.
+
+Other heap-based implementations are possible. For instance, the ProtoZero
+sources provide a helper class `HeapBuffered<TestMsg>`, mainly used in tests (see
+[scattered_heap_buffer.h](/include/perfetto/protozero/scattered_heap_buffer.h)),
+which allocates a new heap buffer when crossing the boundaries of the current
+one.
+
+Consider the following example:
+
+```c++
+TestMsg outer_msg;
+for (int i = 0; i < 1000; i++) {
+ TestMsg* nested = outer_msg.add_nested();
+ nested->set_int_val(42);
+}
+```
+
+At some point one of the `set_int_val()` calls will hit the slow-path and
+acquire a new buffer. The overall idea is having a serialization mechanism
+that is extremely lightweight most of the times and that requires some extra
+function calls when buffer boundary, so that their cost gets amortized across
+all trace events.
+
+In the context of the overall Perfetto tracing use case, the slow-path involves
+grabbing a process-local mutex and finding the next free chunk in the shared
+memory buffer. Hence writes are lock-free as long as they happen within the
+thread-local chunk and require a critical section to acquire a new chunk once
+every 4KB-32KB (depending on the trace configuration).
+
+The assumption is that the likeliness that two threads will cross the chunk
+boundary and call `GetNewBuffer()` at the same time is extremely slow and hence
+the critical section is un-contended most of the times.
+
+```mermaid
+sequenceDiagram
+ participant C as Call site
+ participant M as Message
+ participant SSR as ScatteredStreamWriter
+ participant DEL as Buffer Delegate
+ C->>M: set_int_val(...)
+ activate C
+ M->>SSR: AppendVarInt(...)
+ deactivate C
+ Note over C,SSR: A typical write on the fast-path
+
+ C->>M: set_str_val(...)
+ activate C
+ M->>SSR: AppendString(...)
+ SSR->>DEL: GetNewBuffer(...)
+ deactivate C
+ Note over C,DEL: A write on the slow-path when crossing 4KB - 32KB chunks.
+```
+
+### Deferred patching
+
+Nested messages in the protobuf binary encoding are prefixed with their
+varint-encoded size.
+
+Consider the following:
+
+```c++
+TestMsg* nested = outer_msg.add_nested();
+nested->set_int_val(42);
+nested->set_str_val("foo");
+```
+
+The canonical encoding of this protobuf message, using libprotobuf, would be:
+
+```bash
+1a 07 0a 03 66 6f 6f 10 2a
+^-+-^ ^-----+------^ ^-+-^
+ | | |
+ | | +--> Field ID: 2 [int_val], value = 42.
+ | |
+ | +------> Field ID: 1 [str_val], len = 3, value = "foo" (66 6f 6f).
+ |
+ +------> Field ID: 3 [nested], lenght: 7 # !!!
+```
+
+The second byte in this sequence (07) is problematic for direct encoding. At the
+point where `outer_msg.add_nested()` is called, we can't possibly know upfront
+what the overall size of the nested message will be (in this case, 5 + 2 = 7).
+
+The way we get around this in ProtoZero is by reserving four bytes for the
+_size_ of each nested message and back-filling them once the message is
+finalized (or when we try to set a field in one of the parent messages).
+We do this by encoding the size of the message using redundant varint encoding,
+in this case: `87 80 80 00` instead of `07`.
+
+At the C++ level, the `protozero::Message` class holds a pointer to its `size`
+field, which typically points to the beginning of the message, where the four
+bytes are reserved, and back-fills it in the `Message::Finalize()` pass.
+
+This works fine for cases where the entire message lies in one contiguous buffer
+but opens a further challenge: a message can be several MBs big. Looking at this
+from the overall tracing perspective, the shared memory buffer chunk that holds
+the beginning of a message can be long gone (i.e. committed in the central
+service buffer) by the time we get to the end.
+
+In order to support this use case, at the tracing code level (outside of
+ProtoZero), when a message crosses the buffer boundary, its `size` field gets
+redirected to a temporary patch buffer
+(see [patch_list.h](/src/tracing/core/patch_list.h)). This patch buffer is then
+sent out-of-band, piggybacking over the next commit IPC (see
+[Tracing Protocol ABI](/docs/design-docs/api-and-abi.md#tracing-protocol-abi))
+
+### Performance characteristics
+
+NOTE: For the full code of the benchmark see
+ `/src/protozero/test/protozero_benchmark.cc`
+
+We consider two scenarios: writing a simple event and a nested event
+
+#### Simple event
+
+Consists of filling a flat proto message with of 4 integers (2 x 32-bit,
+2 x 64-bit) and a 32 bytes string, as follows:
+
+```c++
+void FillMessage_Simple(T* msg) {
+ msg->set_field_int32(...);
+ msg->set_field_uint32(...);
+ msg->set_field_int64(...);
+ msg->set_field_uint64(...);
+ msg->set_field_string(...);
+}
+```
+
+#### Nested event
+
+Consists of filling a similar message which is recursively nested 3 levels deep:
+
+```c++
+void FillMessage_Nested(T* msg, int depth = 0) {
+ FillMessage_Simple(msg);
+ if (depth < 3) {
+ auto* child = msg->add_field_nested();
+ FillMessage_Nested(child, depth + 1);
+ }
+}
+```
+
+#### Comparison terms
+
+We compare, for the same message type, the performance of ProtoZero,
+libprotobuf and a speed-of-light serializer.
+
+The speed-of-light serializer is a very simple C++ class that just appends
+data into a linear buffer making all sorts of favourable assumptions. It does
+not use any binary-stable encoding, it does not perform bound checking,
+all writes are 64-bit aligned, it doesn't deal with any thread-safety.
+
+```c++
+struct SOLMsg {
+ template <typename T>
+ void Append(T x) {
+ // The memcpy will be elided by the compiler, which will emit just a
+ // 64-bit aligned mov instruction.
+ memcpy(reinterpret_cast<T*>(ptr_), &x, sizeof(x));
+ ptr_ += sizeof(x);
+ }
+
+ void set_field_int32(int32_t x) { Append(x); }
+ void set_field_uint32(uint32_t x) { Append(x); }
+ void set_field_int64(int64_t x) { Append(x); }
+ void set_field_uint64(uint64_t x) { Append(x); }
+ void set_field_string(const char* str) { ptr_ = strcpy(ptr_, str); }
+
+ char storage_[sizeof(g_fake_input_simple)];
+ char* ptr_ = &storage_[0];
+};
+```
+
+The speed-of-light serializer serves as a reference for _how fast a serializer
+could be if argument marshalling and bound checking were zero cost._
+
+#### Benchmark results
+
+##### Google Pixel 3 - aarch64
+
+```bash
+$ cat out/droid_arm64/args.gn
+target_os = "android"
+is_clang = true
+is_debug = false
+target_cpu = "arm64"
+
+$ ninja -C out/droid_arm64/ perfetto_benchmarks && \
+ adb push --sync out/droid_arm64/perfetto_benchmarks /data/local/tmp/perfetto_benchmarks && \
+ adb shell '/data/local/tmp/perfetto_benchmarks --benchmark_filter=BM_Proto*'
+
+------------------------------------------------------------------------
+Benchmark Time CPU Iterations
+------------------------------------------------------------------------
+BM_Protozero_Simple_Libprotobuf 402 ns 398 ns 1732807
+BM_Protozero_Simple_Protozero 242 ns 239 ns 2929528
+BM_Protozero_Simple_SpeedOfLight 118 ns 117 ns 6101381
+BM_Protozero_Nested_Libprotobuf 1810 ns 1800 ns 390468
+BM_Protozero_Nested_Protozero 780 ns 773 ns 901369
+BM_Protozero_Nested_SpeedOfLight 138 ns 136 ns 5147958
+```
+
+##### HP Z920 workstation (Intel Xeon E5-2690 v4) running Linux
+
+```bash
+
+$ cat out/linux_clang_release/args.gn
+is_clang = true
+is_debug = false
+
+$ ninja -C out/linux_clang_release/ perfetto_benchmarks && \
+ out/linux_clang_release/perfetto_benchmarks --benchmark_filter=BM_Proto*
+
+------------------------------------------------------------------------
+Benchmark Time CPU Iterations
+------------------------------------------------------------------------
+BM_Protozero_Simple_Libprotobuf 428 ns 428 ns 1624801
+BM_Protozero_Simple_Protozero 261 ns 261 ns 2715544
+BM_Protozero_Simple_SpeedOfLight 111 ns 111 ns 6297387
+BM_Protozero_Nested_Libprotobuf 1625 ns 1625 ns 436411
+BM_Protozero_Nested_Protozero 843 ns 843 ns 849302
+BM_Protozero_Nested_SpeedOfLight 140 ns 140 ns 5012910
+```
diff --git a/docs/security-model.md b/docs/design-docs/security-model.md
similarity index 84%
rename from docs/security-model.md
rename to docs/design-docs/security-model.md
index af5a2a1..ad6c2b0 100644
--- a/docs/security-model.md
+++ b/docs/design-docs/security-model.md
@@ -1,26 +1,22 @@
-# Perfetto security model
+# Security model for system-wide tracing on Android/Linux
-*** note
-**This doc is WIP**, stay tuned.
-<!-- TODO(primiano): expand security model doc. -->
-***
-
-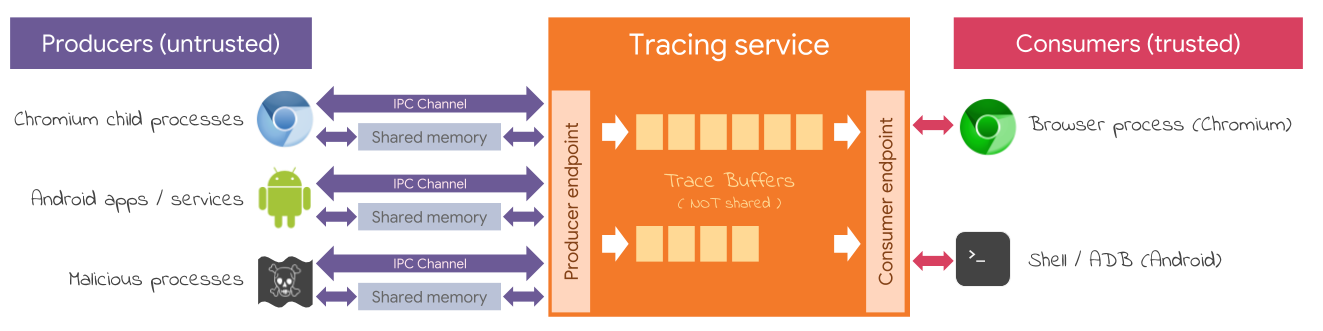
-
-**TL;DR**
-The tracing service has two endpoints (in Chromium: Mojo services, on Android:
-UNIX sockets): one for producer(s) and one for consumer(s).
+The tracing service has two endpoints (in Chromium: Mojo services, on
+Android/Linux: UNIX sockets): one for producer(s) and one for consumer(s).
The former is typically public, the latter is restricted only to trusted
consumers.
-**Producers**
+
+
+## Producers
+
Producers are never trusted. We assume they will try their best to DoS / crash /
exploit the tracing service. We do so at the
[core/tracing_service_impl.cc](/src/tracing/core/tracing_service_impl.cc) so
that the same level of security and testing is applied regardless of the
embedder and the IPC transport.
-**Tracing service**
+## Tracing service
+
- The tracing service has to validate all inputs.
- In the worst case a bug in the tracing service allowing remote code execution,
the tracing service should have no meaningful capabilities to exploit.
@@ -33,24 +29,22 @@
- On Android it runs as nobody:nobody and is allowed to do very little
see [traced.te](https://android.googlesource.com/platform/system/sepolicy/+/master/private/traced.te).
- In Chromium it should run as a utility process.
- - TODO: we could use BPF syscall sandboxing both in Chromium and Android.
- [Proof of concept](https://android-review.googlesource.com/c/platform/external/perfetto/+/576563)
-**Consumers**
+## Consumers
Consumers are always trusted. They still shouldn't be able to crash or exploit
the service. They can easily DoS it though, but that is WAI.
- In Chromium the trust path is established through service manifest.
- In Android the trust path is established locking down the consumer socket
to shell through SELinux.
-**Shared memory isolation**
+## Shared memory isolation
Memory is shared only point-to-point between each producer and the tracing
service. We should never ever share memory across producers (in order to not
leak trace data belonging to different producers) nor between producers and
consumers (that would open a hard to audit path between
untrusted-and-unprivileged and trusted-and-more-privileged entities).
-**Attestation of trace contents**
+## Attestation of trace contents
The tracing service guarantees that the `TracePacket` fields written by the
Service cannot be spoofed by the Producer(s).
Packets that try to define those fields are rejected, modulo clock snapshots.
diff --git a/docs/embedder-guide.md b/docs/embedder-guide.md
deleted file mode 100644
index fa47cea..0000000
--- a/docs/embedder-guide.md
+++ /dev/null
@@ -1,29 +0,0 @@
-# Embedding Perfetto in another project
-
-*** note
-**This doc is WIP**, stay tuned
-<!-- TODO(primiano): write embedder guide doc. -->
-***
-
-
-This doc should:
-- Contain tech details of the Producer(Endpoint), Consumer(Endpoint) and Service
-  interfaces.
-- Explain how they are supposed to be wired up together, with or without
-  using an IPC transport.
-- Explain the basic embedder requirements (e.g. [`TaskRunner`](/include/perfetto/base/task_runner.h))
-- Point out the relevant GN targets:
-  `//src/tracing`, `//src/tracing:ipc`, `//src/ipc`.
-- Explain the API surface:
-  - [producer.h](/include/perfetto/ext/tracing/core/producer.h)
-  - [consumer.h](/include/perfetto/ext/tracing/core/consumer.h)
-  - [service.h](/include/perfetto/ext/tracing/core/tracing_service.h)
-- Explain the ABI surface:
-  - [shared_memory_abi.h](/include/perfetto/ext/tracing/core/shared_memory_abi.h)
-  - IPC's [wire protocol](/protos/perfetto/ipc/wire_protocol.proto) (if used)
-  - The input [config protos](/protos/perfetto/config)
-  - The output [trace protos](/protos/perfetto/trace)
-
-Other resources
----------------
-* How we wrap our own IPC transport in Android: [/src/tracing/ipc](/src/tracing/ipc).
diff --git a/docs/ftrace.md b/docs/ftrace.md
deleted file mode 100644
index 6e29fc5..0000000
--- a/docs/ftrace.md
+++ /dev/null
@@ -1,16 +0,0 @@
-# Perfetto <-> Ftrace interoperability
-
-*** note
-**This doc is WIP**, stay tuned.
-<!-- TODO(primiano): write ftrace doc. -->
-***
-
-This doc should:
-- Describe the ftrace trace_pipe_raw -> protobuf translation.
-- Describe how we deal with kernel ABI (in)stability and ftrace fields changing
-  over kernel versions (we process `event/**/format files on-device`).
-- Describe how to generate ftrace protos (`tools/pull_ftrace_format_files.py`,
-  `tools/udate_protos.py`)
-- Describe how session multiplexing works.
-
-Code lives in [/src/traced/probes/ftrace](/src/traced/probes/ftrace/).
diff --git a/docs/heapprofd.md b/docs/heapprofd.md
deleted file mode 100644
index b10fec9..0000000
--- a/docs/heapprofd.md
+++ /dev/null
@@ -1,360 +0,0 @@
-# heapprofd - Android Heap Profiler
-
-**heapprofd requires Android 10.**
-
-heapprofd is a tool that tracks native heap allocations & deallocations of an
-Android process within a given time period. The resulting profile can be used
-to attribute memory usage to particular function callstacks, supporting a mix
-of both native and java code. The tool can be used by Android platform and app
-developers to investigate memory issues.
-
-On debug Android builds, you can profile all apps and most system services.
-On "user" builds, you can only use it on apps with the debuggable or
-profileable manifest flag.
-
-## Quickstart
-
-<!-- This uses github because gitiles does not allow to get the raw file. -->
-
-On Linux / MacOS, use the `tools/heap_profile` script to heap profile a
-process. If you are having trouble make sure you are using the
-[latest version](
-https://raw.githubusercontent.com/google/perfetto/master/tools/heap_profile).
-
-See all the arguments using `tools/heap_profile -h`, or use the defaults
-and just profile a process (e.g. `system_server`):
-
-```
-$ tools/heap_profile --name system_server
-Profiling active. Press Ctrl+C to terminate.
-^CWrote profiles to /tmp/heap_profile-XSKcZ3i (symlink /tmp/heap_profile-latest)
-These can be viewed using pprof. Googlers: head to pprof/ and upload them.
-```
-
-This will create a pprof-compatible heap dump when Ctrl+C is pressed.
-
-If you are having problems, run the following command and try again:
-
-```
-$ adb shell setprop persist.traced.enable 1
-```
-
-You can also use the [Perfetto UI](https://ui.perfetto.dev/#!/record?p=memory)
-to record heapprofd profiles. Tick "Heap profiling" in the trace configuration,
-enter the processes you want to target, click "Add Device" to pair your phone,
-and record profiles straight from your browser. This is also possible on
-Windows.
-
-## Viewing the data
-
-The resulting profile proto contains four views on the data
-
-* **space**: how many bytes were allocated but not freed at this callstack the
-  moment the dump was created.
-* **alloc\_space**: how many bytes were allocated (including ones freed at the
-  moment of the dump) at this callstack
-* **objects**: how many allocations without matching frees were done at this
-  callstack.
-* **alloc\_objects**: how many allocations (including ones with matching frees)
-  were done at this callstack.
-
-**Googlers:** Head to http://pprof/ and upload the gzipped protos to get a
-visualization. *Tip: you might want to put `libart.so` as a "Hide regex" when
-profiling apps.*
-
-You can use the [Perfetto UI](https://ui.perfetto.dev) to visualize heap dumps.
-Upload the `raw-trace` file in your output directory. You will see all heap
-dumps as diamonds on the timeline, click any of them to get a flamegraph.
-
-Alternatively [Speedscope](https://speedscope.app) can be used to visualize
-the gzipped protos, but will only show the space view.
-*Tip: Click Left Heavy on the top left for a good visualisation.*
-
-## Sampling interval
-heapprofd samples heap allocations. Given a sampling interval of n bytes,
-one allocation is sampled, on average, every n bytes allocated. This allows to
-reduce the performance impact on the target process. The default sampling rate
-is 4096 bytes.
-
-The easiest way to reason about this is to imagine the memory allocations as a
-steady stream of one byte allocations. From this stream, every n-th byte is
-selected as a sample, and the corresponding allocation gets attributed the
-complete n bytes. As an optimization, we sample allocations larger than the
-sampling interval with their true size.
-
-To make this statistically more meaningful, Poisson sampling is employed.
-Instead of a static parameter of n bytes, the user can only choose the mean
-value around which the interval is distributed. This makes sure frequent small
-allocations get sampled as well as infrequent large ones.
-
-## Startup profiling
-When a profile session names processes by name and a matching process is
-started, it gets profiled from the beginning. The resulting profile will
-contain all allocations done between the start of the process and the end
-of the profiling session.
-
-On Android, Java apps are usually not started, but the zygote forks and then
-specializes into the desired app. If the app's name matches a name specified
-in the profiling session, profiling will be enabled as part of the zygote
-specialization. The resulting profile contains all allocations done between
-that point in zygote specialization and the end of the profiling session.
-Some allocations done early in the specialization process are not accounted
-for.
-
-The Resulting `ProfileProto` will have `from_startup` set  to true in the
-corresponding `ProcessHeapSamples` message. This does not get surfaced in the
-converted pprof compatible proto.
-
-## Runtime profiling
-When a profile session is started, all matching processes (by name or PID)
-are enumerated and profiling is enabled. The resulting profile will contain
-all allocations done between the beginning and the end of the profiling
-session.
-
-The Resulting `ProfileProto` will have `from_startup` set  to false in the
-corresponding `ProcessHeapSamples` message. This does not get surfaced in the
-converted pprof compatible proto.
-
-## Concurrent profiling sessions
-If multiple sessions name the same target process (either by name or PID),
-only the first relevant session will profile the process. The other sessions
-will report that the process had already been profiled when converting to
-the pprof compatible proto.
-
-If you see this message but do not expect any other sessions, run
-```
-adb shell killall -KILL perfetto
-```
-to stop any concurrent sessions that may be running.
-
-
-The Resulting `ProfileProto` will have `rejected_concurrent` set  to true in
-otherwise empty corresponding `ProcessHeapSamples` message. This does not get
-surfaced in the converted pprof compatible proto.
-
-## Target processes
-Depending on the build of Android that heapprofd is run on, some processes
-are not be eligible to be profiled.
-
-On user builds, only Java applications with either the profileable or the
-debuggable manifest flag set can be profiled. Profiling requests for other
-processes will result in an empty profile.
-
-On userdebug builds, all processes except for a small blacklist of critical
-services can be profiled (to find the blacklist, look for
-`never_profile_heap` in [heapprofd.te](
-https://android.googlesource.com/platform/system/sepolicy/+/refs/heads/master/private/heapprofd.te)).
-This restriction can be lifted by disabling SELinux by running
-`adb shell su root setenforce 0` or by passing `--disable-selinux` to the
-`heap_profile` script.
-
-|                         | userdebug setenforce 0 | userdebug | user |
-|-------------------------|------------------------|-----------|------|
-| critical native service |            y           |     n     |  n   |
-| native service          |            y           |     y     |  n   |
-| app                     |            y           |     y     |  n   |
-| profileable app         |            y           |     y     |  y   |
-| debuggable app          |            y           |     y     |  y   |
-
-## DEDUPED frames
-If the name of a Java method includes `[DEDUPED]`, this means that multiple
-methods share the same code. ART only stores the name of a single one in its
-metadata, which is displayed here. This is not necessarily the one that was
-called.
-
-## Manual dumping
-You can trigger a manual dump of all currently profiled processes by running
-`adb shell killall -USR1 heapprofd`. This can be useful for seeing the current
-memory usage of the target in a specific state.
-
-This dump will show up in addition to the dump at the end of the profile that is
-always produced. You can create multiple of these dumps, and they will be
-enumerated in the output directory.
-
-## Symbolization
-**Symbolization is currently only available on Linux.**
-
-### Set up llvm-symbolizer
-You only need to do this once.
-
-To use symbolization, your system must have llvm-symbolizer installed and
-accessible from `$PATH` as `llvm-symbolizer`. On Debian, you can install it
-using `sudo apt install llvm-9`.
-This will create `/usr/bin/llvm-symbolizer-9`. Symlink that to somewhere in
-your `$PATH` as `llvm-symbolizer`. For instance.
-
-For instance, `ln -s /usr/bin/llvm-symbolizer-9 ~/bin/llvm-symbolizer`, and
-add `~/bin` to your path (or run the commands below with `PATH=~/bin:$PATH`
-prefixed).
-
-### Symbolize your profile
-
-If the profiled binary or libraries do not have symbol names, you can
-symbolize profiles offline. Even if they do, you might want to symbolize in
-order to get inlined function and line number information. All tools
-traceconv, trace_processor_shell, the heap_profile script) support specifying
-the `PERFETTO_BINARY_PATH` as an environment variable.
-
-```
-PERFETTO_BINARY_PATH=somedir tools/heap_profile --name ${NAME}
-```
-
-and the output files (`*.pb.gz`) will be symbolized.
-
-You can persist symbols for a trace by running
-`PERFETTO_BINARY_PATH=somedir tools/traceconv symbolize raw-trace > symbols`.
-You can then concatenate the symbols to the trace (
-`cat raw-trace symbols > symbolized-trace`) and the symbols will part of
-`symbolized-trace`.
-
-## Troubleshooting
-
-### Buffer overrun
-If the rate of allocations is too high for heapprofd to keep up, the profiling
-session will end early due to a buffer overrun. If the buffer overrun is
-caused by a transient spike in allocations, increasing the shared memory buffer
-size (passing `--shmem-size` to heap\_profile) can resolve the issue.
-Otherwise the sampling interval can be increased (at the expense of lower
-accuracy in the resulting profile) by passing `--interval` to heap\_profile.
-
-### Profile is empty
-Check whether your target process is eligible to be profiled by consulting
-[Target processes](#target-processes) above.
-
-Also check the [Known Issues](#known-issues).
-
-
-### Impossible callstacks
-If you see a callstack that seems to impossible from looking at the code, make
-sure no [DEDUPED frames](#deduped-frames) are involved.
-
-
-### Symbolization: Could not find library
-
-When symbolizing a profile, you might come accross messages like this:
-
-```
-Could not find /data/app/invalid.app-wFgo3GRaod02wSvPZQ==/lib/arm64/somelib.so
-(Build ID: 44b7138abd5957b8d0a56ce86216d478).
-```
-
-Check whether your library (in this example somelib.so) exists in
-`PERFETTO_BINARY_PATH`. Then compare the Build ID to the one in your
-symbol file, which you can get by running
-`readelf -n /path/in/binary/path/somelib.so`. If it does not match, the
-symbolized file has a different version than the one on device, and cannot
-be used for symbolization.
-If it does, try moving somelib.so to the root of `PERFETTO_BINARY_PATH` and
-try again.
-
-## Known Issues
-
-### Android 10
-* Does not work on x86 platforms (including the Android cuttlefish emulator).
-* If heapprofd is run standalone (by running `heapprofd` in a root shell, rather
-  than through init), `/dev/socket/heapprofd` get assigned an incorrect SELinux
-  domain. You will not be able to profile any processes unless you disable
-  SELinux enforcement.
-  Run `restorecon /dev/socket/heapprofd` in a root shell to resolve.
-
-## Ways to count memory
-
-When using heapprofd and interpreting results, it is important to know the
-precise meaning of the different memory metrics that can be obtained from the
-operating system.
-
-**heapprofd** gives you the number of bytes the target program
-requested from the allocator. If you are profiling a Java app from startup,
-allocations that happen early in the application's initialization will not be
-visible to heapprofd. Native services that do not fork from the Zygote
-are not affected by this.
-
-**malloc\_info** is a libc function that gives you information about the
-allocator. This can be triggered on userdebug builds by using
-`am dumpheap -m <PID> /data/local/tmp/heap.txt`. This will in general be more
-than the memory seen by heapprofd, depending on the allocator not all memory
-is immediately freed. In particular, jemalloc retains some freed memory in
-thread caches.
-
-**Heap RSS** is the amount of memory requested from the operating system by the
-allocator. This is larger than the previous two numbers because memory can only
-be obtained in page size chunks, and fragmentation causes some of that memory to
-be wasted. This can be obtained by running `adb shell dumpsys meminfo <PID>` and
-looking at the "Private Dirty" column.
-
-|                     | heapprofd         | malloc\_info | RSS |
-|---------------------|-------------------|--------------|-----|
-| from native startup |          x        |      x       |  x  |
-| after zygote init   |          x        |      x       |  x  |
-| before zygote init  |                   |      x       |  x  |
-| thread caches       |                   |      x       |  x  |
-| fragmentation       |                   |              |  x  |
-
-If you observe high RSS or malloc\_info metrics but heapprofd does not match,
-there might be a problem with fragmentation or the allocator.
-
-## Manual instructions
-*It is not recommended to use these instructions unless you have advanced
-requirements or are developing heapprofd. Proceed with caution*
-
-### Download trace\_to\_text
-Download the latest trace\_to\_text for [Linux](
-https://storage.googleapis.com/perfetto/trace_to_text-4ab1d18e69bc70e211d27064505ed547aa82f919)
-or [MacOS](https://storage.googleapis.com/perfetto/trace_to_text-mac-2ba325f95c08e8cd5a78e04fa85ee7f2a97c847e).
-This is needed to convert the Perfetto trace to a pprof-compatible file.
-
-Compare the `sha1sum` of this file to the one contained in the file name.
-
-### Start profiling
-To start profiling the process `${PID}`, run the following sequence of commands.
-Adjust the `INTERVAL` to trade-off runtime impact for higher accuracy of the
-results. If `INTERVAL=1`, every allocation is sampled for maximum accuracy.
-Otherwise, a sample is taken every `INTERVAL` bytes on average.
-
-```bash
-INTERVAL=4096
-
-echo '
-buffers {
-  size_kb: 102400
-}
-
-data_sources {
-  config {
-    name: "android.heapprofd"
-    target_buffer: 0
-    heapprofd_config {
-      sampling_interval_bytes: '${INTERVAL}'
-      pid: '${PID}'
-    }
-  }
-}
-
-duration_ms: 20000
-' | adb shell perfetto --txt -c - -o /data/misc/perfetto-traces/profile
-
-adb pull /data/misc/perfetto-traces/profile /tmp/profile
-```
-
-### Convert to pprof compatible file
-
-While we work on UI support, you can convert the trace into pprof compatible
-heap dumps.
-
-Use the trace\_to\_text file downloaded above, with XXXXXXX replaced with the
-`sha1sum` of the file.
-
-```
-trace_to_text-linux-XXXXXXX profile /tmp/profile
-```
-
-This will create a directory in `/tmp/` containing the heap dumps. Run
-
-```
-gzip /tmp/heap_profile-XXXXXX/*.pb
-```
-
-to get gzipped protos, which tools handling pprof profile protos expect.
-
-Follow the instructions in [Viewing the Data](#viewing-the-data) to visualise
-the results.
diff --git a/docs/images/android_logs.png b/docs/images/android_logs.png
new file mode 100644
index 0000000..a4d6261
--- /dev/null
+++ b/docs/images/android_logs.png
Binary files differ
diff --git a/docs/images/annotation-slice.png b/docs/images/annotation-slice.png
index fb950f1..d20fce2 100644
--- a/docs/images/annotation-slice.png
+++ b/docs/images/annotation-slice.png
Binary files differ
diff --git a/docs/images/api-and-abi.png b/docs/images/api-and-abi.png
new file mode 100644
index 0000000..0711be3
--- /dev/null
+++ b/docs/images/api-and-abi.png
Binary files differ
diff --git a/docs/images/atrace-slices.png b/docs/images/atrace-slices.png
new file mode 100644
index 0000000..9101241
--- /dev/null
+++ b/docs/images/atrace-slices.png
Binary files differ
diff --git a/docs/images/battery-counters-ui.png b/docs/images/battery-counters-ui.png
new file mode 100644
index 0000000..757b00a
--- /dev/null
+++ b/docs/images/battery-counters-ui.png
Binary files differ
diff --git a/docs/images/battery-counters.png b/docs/images/battery-counters.png
new file mode 100644
index 0000000..6b7202c
--- /dev/null
+++ b/docs/images/battery-counters.png
Binary files differ
diff --git a/docs/images/buffers.png b/docs/images/buffers.png
new file mode 100644
index 0000000..5b3ea84
--- /dev/null
+++ b/docs/images/buffers.png
Binary files differ
diff --git a/docs/images/camera-slices.png b/docs/images/camera-slices.png
new file mode 100644
index 0000000..450a058
--- /dev/null
+++ b/docs/images/camera-slices.png
Binary files differ
diff --git a/docs/images/continuous-integration.png b/docs/images/continuous-integration.png
new file mode 100644
index 0000000..899df97
--- /dev/null
+++ b/docs/images/continuous-integration.png
Binary files differ
diff --git a/docs/images/counters.png b/docs/images/counters.png
new file mode 100644
index 0000000..a33bd67
--- /dev/null
+++ b/docs/images/counters.png
Binary files differ
diff --git a/docs/images/cpu-bar-graphs.png b/docs/images/cpu-bar-graphs.png
new file mode 100644
index 0000000..8bb1ae0
--- /dev/null
+++ b/docs/images/cpu-bar-graphs.png
Binary files differ
diff --git a/docs/images/cpu-frequency.png b/docs/images/cpu-frequency.png
new file mode 100644
index 0000000..1f2cd91
--- /dev/null
+++ b/docs/images/cpu-frequency.png
Binary files differ
diff --git a/docs/images/cpu-sched-details.png b/docs/images/cpu-sched-details.png
new file mode 100644
index 0000000..adf4e4d
--- /dev/null
+++ b/docs/images/cpu-sched-details.png
Binary files differ
diff --git a/docs/images/cpu-slice-track.png b/docs/images/cpu-slice-track.png
new file mode 100644
index 0000000..892790c
--- /dev/null
+++ b/docs/images/cpu-slice-track.png
Binary files differ
diff --git a/docs/images/cpu-zoomed.png b/docs/images/cpu-zoomed.png
new file mode 100644
index 0000000..aeeceb7
--- /dev/null
+++ b/docs/images/cpu-zoomed.png
Binary files differ
diff --git a/docs/images/dataflow.svg b/docs/images/dataflow.svg
new file mode 100644
index 0000000..853e643
--- /dev/null
+++ b/docs/images/dataflow.svg
@@ -0,0 +1,15 @@
+<svg id="ec4qhmsv5c9j1" xmlns="http://www.w3.org/2000/svg" xmlns:xlink="http://www.w3.org/1999/xlink" viewBox="0 0 520 150" shape-rendering="geometricPrecision" text-rendering="geometricPrecision"><style><![CDATA[#ec4qhmsv5c9j1{pointer-events: all}#ec4qhmsv5c9j1 * {animation-play-state: paused !important}#ec4qhmsv5c9j1:hover * {animation-play-state: running !important}#ec4qhmsv5c9j5_ts {animation: ec4qhmsv5c9j5_ts__ts 25000ms linear infinite normal forwards}@keyframes ec4qhmsv5c9j5_ts__ts { 0% {transform: translate(79.984375px,105px) scale(1,1)} 32% {transform: translate(79.984375px,105px) scale(1,1);animation-timing-function: cubic-bezier(0.680000,-0.550000,0.265000,1.550000)} 34% {transform: translate(79.984375px,105px) scale(1.050000,1.150000);animation-timing-function: cubic-bezier(0.680000,-0.550000,0.265000,1.550000)} 36% {transform: translate(79.984375px,105px) scale(1,1)} 100% {transform: translate(79.984375px,105px) scale(1,1)} }#ec4qhmsv5c9j25_ts {animation: ec4qhmsv5c9j25_ts__ts 25000ms linear infinite normal forwards}@keyframes ec4qhmsv5c9j25_ts__ts { 0% {transform: translate(79.984375px,75px) scale(1,1)} 1.600000% {transform: translate(79.984375px,75px) scale(1,1);animation-timing-function: cubic-bezier(0.680000,-0.550000,0.265000,1.550000)} 3.600000% {transform: translate(79.984375px,75px) scale(1.052943,1.046628);animation-timing-function: cubic-bezier(0.680000,-0.550000,0.265000,1.550000)} 5.600000% {transform: translate(79.984375px,75px) scale(1,1)} 100% {transform: translate(79.984375px,75px) scale(1,1)} }#ec4qhmsv5c9j36 {animation: ec4qhmsv5c9j36_f_p 25000ms linear infinite normal forwards}@keyframes ec4qhmsv5c9j36_f_p { 0% {fill: rgb(245,245,245)} 15.840000% {fill: rgb(245,245,245);animation-timing-function: cubic-bezier(0.785000,0.135000,0.150000,0.860000)} 18% {fill: rgb(253,214,99);animation-timing-function: cubic-bezier(0.785000,0.135000,0.150000,0.860000)} 20% {fill: rgb(245,245,245)} 47.200000% {fill: rgb(245,245,245);animation-timing-function: cubic-bezier(0.785000,0.135000,0.150000,0.860000)} 49.360000% {fill: rgb(253,214,99);animation-timing-function: cubic-bezier(0.785000,0.135000,0.150000,0.860000)} 51.360000% {fill: rgb(245,245,245)} 100% {fill: rgb(245,245,245)} }#ec4qhmsv5c9j37 {animation: ec4qhmsv5c9j37_f_p 25000ms linear infinite normal forwards}@keyframes ec4qhmsv5c9j37_f_p { 0% {fill: rgb(245,245,245)} 80.880000% {fill: rgb(245,245,245);animation-timing-function: cubic-bezier(0.785000,0.135000,0.150000,0.860000)} 83.040000% {fill: rgb(253,214,99);animation-timing-function: cubic-bezier(0.785000,0.135000,0.150000,0.860000)} 85.040000% {fill: rgb(245,245,245)} 100% {fill: rgb(245,245,245)} }#ec4qhmsv5c9j48_to {animation: ec4qhmsv5c9j48_to__to 25000ms linear infinite normal forwards}@keyframes ec4qhmsv5c9j48_to__to { 0% {transform: translate(0px,0px)} 21.840000% {transform: translate(0px,0px);animation-timing-function: cubic-bezier(1,0,0,1)} 25.600000% {transform: translate(110px,45.500000px)} 100% {transform: translate(110px,45.500000px)} }#ec4qhmsv5c9j49_ts {animation: ec4qhmsv5c9j49_ts__ts 25000ms linear infinite normal forwards}@keyframes ec4qhmsv5c9j49_ts__ts { 0% {transform: translate(225px,68px) scale(0,0)} 12.080000% {transform: translate(225px,68px) scale(0,0);animation-timing-function: cubic-bezier(0.680000,-0.550000,0.265000,1.550000)} 14% {transform: translate(225px,68px) scale(1,1)} 100% {transform: translate(225px,68px) scale(1,1)} }#ec4qhmsv5c9j50_ts {animation: ec4qhmsv5c9j50_ts__ts 25000ms linear infinite normal forwards}@keyframes ec4qhmsv5c9j50_ts__ts { 0% {transform: translate(225px,41px) scale(0,0)} 6% {transform: translate(225px,41px) scale(0,0);animation-timing-function: cubic-bezier(0.680000,-0.550000,0.265000,1.550000)} 8% {transform: translate(225px,41px) scale(1,1)} 100% {transform: translate(225px,41px) scale(1,1)} }#ec4qhmsv5c9j51_ts {animation: ec4qhmsv5c9j51_ts__ts 25000ms linear infinite normal forwards}@keyframes ec4qhmsv5c9j51_ts__ts { 0% {transform: translate(225px,50px) scale(0,0)} 8% {transform: translate(225px,50px) scale(0,0);animation-timing-function: cubic-bezier(0.680000,-0.550000,0.265000,1.550000)} 10% {transform: translate(225px,50px) scale(1,1)} 100% {transform: translate(225px,50px) scale(1,1)} }#ec4qhmsv5c9j52_ts {animation: ec4qhmsv5c9j52_ts__ts 25000ms linear infinite normal forwards}@keyframes ec4qhmsv5c9j52_ts__ts { 0% {transform: translate(225px,59px) scale(0,0)} 10% {transform: translate(225px,59px) scale(0,0);animation-timing-function: cubic-bezier(0.680000,-0.550000,0.265000,1.550000)} 12% {transform: translate(225px,59px) scale(1,1)} 100% {transform: translate(225px,59px) scale(1,1)} }#ec4qhmsv5c9j53_to {animation: ec4qhmsv5c9j53_to__to 25000ms linear infinite normal forwards}@keyframes ec4qhmsv5c9j53_to__to { 0% {transform: translate(0px,0px)} 85.600000% {transform: translate(0px,0px);animation-timing-function: cubic-bezier(1,0,0,1)} 88% {transform: translate(110px,45.476563px)} 100% {transform: translate(110px,45.476563px)} }#ec4qhmsv5c9j54_ts {animation: ec4qhmsv5c9j54_ts__ts 25000ms linear infinite normal forwards}@keyframes ec4qhmsv5c9j54_ts__ts { 0% {transform: translate(245px,41px) scale(0,0)} 62.960000% {transform: translate(245px,41px) scale(0,0);animation-timing-function: cubic-bezier(0.785000,0.135000,0.150000,0.860000)} 64.960000% {transform: translate(245px,41px) scale(1,1)} 100% {transform: translate(245px,41px) scale(1,1)} }#ec4qhmsv5c9j55_ts {animation: ec4qhmsv5c9j55_ts__ts 25000ms linear infinite normal forwards}@keyframes ec4qhmsv5c9j55_ts__ts { 0% {transform: translate(245px,50px) scale(0,0)} 64.960000% {transform: translate(245px,50px) scale(0,0);animation-timing-function: cubic-bezier(0.785000,0.135000,0.150000,0.860000)} 66.960000% {transform: translate(245px,50px) scale(1,1)} 100% {transform: translate(245px,50px) scale(1,1)} }#ec4qhmsv5c9j56_ts {animation: ec4qhmsv5c9j56_ts__ts 25000ms linear infinite normal forwards}@keyframes ec4qhmsv5c9j56_ts__ts { 0% {transform: translate(245px,59px) scale(0,0)} 71.760000% {transform: translate(245px,59px) scale(0,0);animation-timing-function: cubic-bezier(0.785000,0.135000,0.150000,0.860000)} 73.760000% {transform: translate(245px,59px) scale(1,1)} 100% {transform: translate(245px,59px) scale(1,1)} }#ec4qhmsv5c9j58_to {animation: ec4qhmsv5c9j58_to__to 25000ms linear infinite normal forwards}@keyframes ec4qhmsv5c9j58_to__to { 0% {transform: translate(0px,0px)} 52% {transform: translate(0px,0px);animation-timing-function: cubic-bezier(1,0,0,1)} 55.200000% {transform: translate(110px,45.476563px)} 100% {transform: translate(110px,45.476563px)} }#ec4qhmsv5c9j59_ts {animation: ec4qhmsv5c9j59_ts__ts 25000ms linear infinite normal forwards}@keyframes ec4qhmsv5c9j59_ts__ts { 0% {transform: translate(234.992188px,41px) scale(0,0)} 38% {transform: translate(234.992188px,41px) scale(0,0);animation-timing-function: cubic-bezier(0.785000,0.135000,0.150000,0.860000)} 40% {transform: translate(234.992188px,41px) scale(1,1)} 100% {transform: translate(234.992188px,41px) scale(1,1)} }#ec4qhmsv5c9j60_ts {animation: ec4qhmsv5c9j60_ts__ts 25000ms linear infinite normal forwards}@keyframes ec4qhmsv5c9j60_ts__ts { 0% {transform: translate(234.992188px,50px) scale(0,0)} 40% {transform: translate(234.992188px,50px) scale(0,0);animation-timing-function: cubic-bezier(0.785000,0.135000,0.150000,0.860000)} 42% {transform: translate(234.992188px,50px) scale(1,1)} 100% {transform: translate(234.992188px,50px) scale(1,1)} }#ec4qhmsv5c9j61_ts {animation: ec4qhmsv5c9j61_ts__ts 25000ms linear infinite normal forwards}@keyframes ec4qhmsv5c9j61_ts__ts { 0% {transform: translate(234.992188px,59px) scale(0,0)} 42% {transform: translate(234.992188px,59px) scale(0,0);animation-timing-function: cubic-bezier(0.785000,0.135000,0.150000,0.860000)} 44% {transform: translate(234.992188px,59px) scale(1,1)} 100% {transform: translate(234.992188px,59px) scale(1,1)} }#ec4qhmsv5c9j62_ts {animation: ec4qhmsv5c9j62_ts__ts 25000ms linear infinite normal forwards}@keyframes ec4qhmsv5c9j62_ts__ts { 0% {transform: translate(234.992188px,68px) scale(0,0)} 44% {transform: translate(234.992188px,68px) scale(0,0);animation-timing-function: cubic-bezier(0.785000,0.135000,0.150000,0.860000)} 46% {transform: translate(234.992188px,68px) scale(1,1)} 100% {transform: translate(234.992188px,68px) scale(1,1)} }#ec4qhmsv5c9j63_to {animation: ec4qhmsv5c9j63_to__to 25000ms linear infinite normal forwards}@keyframes ec4qhmsv5c9j63_to__to { 0% {transform: translate(0px,0px)} 88% {transform: translate(0px,0px);animation-timing-function: cubic-bezier(1,0,0,1)} 90.400000% {transform: translate(110px,45.500000px)} 100% {transform: translate(110px,45.500000px)} }#ec4qhmsv5c9j64_ts {animation: ec4qhmsv5c9j64_ts__ts 25000ms linear infinite normal forwards}@keyframes ec4qhmsv5c9j64_ts__ts { 0% {transform: translate(255px,41px) scale(0,0)} 67.200000% {transform: translate(255px,41px) scale(0,0);animation-timing-function: cubic-bezier(0.785000,0.135000,0.150000,0.860000)} 69.200000% {transform: translate(255px,41px) scale(1,1)} 100% {transform: translate(255px,41px) scale(1,1)} }#ec4qhmsv5c9j65_ts {animation: ec4qhmsv5c9j65_ts__ts 25000ms linear infinite normal forwards}@keyframes ec4qhmsv5c9j65_ts__ts { 0% {transform: translate(255px,50px) scale(0,0)} 69.840000% {transform: translate(255px,50px) scale(0,0);animation-timing-function: cubic-bezier(0.785000,0.135000,0.150000,0.860000)} 71.840000% {transform: translate(255px,50px) scale(1,1)} 100% {transform: translate(255px,50px) scale(1,1)} }#ec4qhmsv5c9j66_ts {animation: ec4qhmsv5c9j66_ts__ts 25000ms linear infinite normal forwards}@keyframes ec4qhmsv5c9j66_ts__ts { 0% {transform: translate(255px,59px) scale(0,0)} 74.160000% {transform: translate(255px,59px) scale(0,0);animation-timing-function: cubic-bezier(0.785000,0.135000,0.150000,0.860000)} 76.160000% {transform: translate(255px,59px) scale(1,1)} 100% {transform: translate(255px,59px) scale(1,1)} }#ec4qhmsv5c9j67_ts {animation: ec4qhmsv5c9j67_ts__ts 25000ms linear infinite normal forwards}@keyframes ec4qhmsv5c9j67_ts__ts { 0% {transform: translate(239.133524px,134.619247px) scale(0,0)} 78% {transform: translate(239.133524px,134.619247px) scale(0,0);animation-timing-function: cubic-bezier(1,0,0,1)} 80% {transform: translate(239.133524px,134.619247px) scale(0.464557,0.464557)} 96.160000% {transform: translate(239.133524px,134.619247px) scale(0.464557,0.464557);animation-timing-function: cubic-bezier(1,0,0,1)} 97.760000% {transform: translate(239.133524px,134.619247px) scale(0,0)} 100% {transform: translate(239.133524px,134.619247px) scale(0,0)} }#ec4qhmsv5c9j72 {animation: ec4qhmsv5c9j72_c_o 25000ms linear infinite normal forwards}@keyframes ec4qhmsv5c9j72_c_o { 0% {opacity: 0.420000} 0.400000% {opacity: 0} 100% {opacity: 0} }]]></style><g id="ec4qhmsv5c9j2"><g id="ec4qhmsv5c9j3"><rect id="ec4qhmsv5c9j4" width="160" height="130" rx="0" ry="0" transform="matrix(-1 0 -0 -1 159.98437500000000 130)" fill="rgb(245,245,245)" stroke="none" stroke-width="1"/><g id="ec4qhmsv5c9j5_ts" transform="translate(79.984375,105) scale(1,1)"><rect id="ec4qhmsv5c9j5" width="140" height="30" rx="0" ry="0" transform="translate(-69.984375,-15)" fill="rgb(187,222,251)" stroke="none" stroke-width="1"/></g><rect id="ec4qhmsv5c9j6" width="200" height="60" rx="0" ry="0" transform="matrix(-1 0 -0 -1 520 60.00000000000004)" fill="rgb(253,226,147)" stroke="none" stroke-width="1"/><rect id="ec4qhmsv5c9j7" width="200" height="70" rx="0" ry="0" transform="matrix(-1 0 -0 -1 520 130.00000000000006)" fill="rgb(253,214,99)" stroke="none" stroke-width="1"/><rect id="ec4qhmsv5c9j8" width="10" height="40" rx="0" ry="0" transform="matrix(-1 0 -0 -1 340 120.00000000000004)" fill="rgb(254,247,224)" stroke="rgb(154,160,166)" stroke-width="1"/><rect id="ec4qhmsv5c9j9" width="10" height="40" rx="0" ry="0" transform="matrix(-1 0 -0 -1 350 120.00000000000004)" fill="rgb(254,247,224)" stroke="rgb(154,160,166)" stroke-width="1"/><rect id="ec4qhmsv5c9j10" width="10" height="40" rx="0" ry="0" transform="matrix(-1 0 -0 -1 360 120.00000000000004)" fill="rgb(254,247,224)" stroke="rgb(154,160,166)" stroke-width="1"/><rect id="ec4qhmsv5c9j11" width="10" height="40" rx="0" ry="0" transform="matrix(-1 0 -0 -1 370 120.00000000000004)" fill="rgb(254,247,224)" stroke="rgb(154,160,166)" stroke-width="1"/><rect id="ec4qhmsv5c9j12" width="10" height="40" rx="0" ry="0" transform="matrix(-1 0 -0 -1 380 120.00000000000004)" fill="rgb(254,247,224)" stroke="rgb(154,160,166)" stroke-width="1"/><rect id="ec4qhmsv5c9j13" width="10" height="40" rx="0" ry="0" transform="matrix(-1 0 -0 -1 390 120.00000000000004)" fill="rgb(254,247,224)" stroke="rgb(154,160,166)" stroke-width="1"/><rect id="ec4qhmsv5c9j14" width="10" height="40" rx="0" ry="0" transform="matrix(-1 0 -0 -1 400 120.00000000000004)" fill="rgb(254,247,224)" stroke="rgb(154,160,166)" stroke-width="1"/><rect id="ec4qhmsv5c9j15" width="10" height="40" rx="0" ry="0" transform="matrix(-1 0 -0 -1 410 120.00000000000004)" fill="rgb(254,247,224)" stroke="rgb(154,160,166)" stroke-width="1"/><rect id="ec4qhmsv5c9j16" width="10" height="40" rx="0" ry="0" transform="matrix(-1 0 -0 -1 420 120.00000000000006)" fill="rgb(254,247,224)" stroke="rgb(154,160,166)" stroke-width="1"/><rect id="ec4qhmsv5c9j17" width="10" height="40" rx="0" ry="0" transform="matrix(-1 0 -0 -1 430 120.00000000000006)" fill="rgb(254,247,224)" stroke="rgb(154,160,166)" stroke-width="1"/><rect id="ec4qhmsv5c9j18" width="10" height="40" rx="0" ry="0" transform="matrix(-1 0 -0 -1 440 120.00000000000006)" fill="rgb(254,247,224)" stroke="rgb(154,160,166)" stroke-width="1"/><rect id="ec4qhmsv5c9j19" width="70" height="20" rx="0" ry="0" transform="matrix(1 0 0 1 440 90)" fill="none" fill-rule="evenodd" stroke="none" stroke-width="1"/><g id="ec4qhmsv5c9j20" transform="matrix(1 0 0 1 448.50000000000000 88.50000000000000)"><g id="ec4qhmsv5c9j21"><text id="ec4qhmsv5c9j22" dx="0" dy="0" font-family="RobotoMono-Regular, "Roboto Mono"" font-size="14" transform="matrix(1 0 0 1 0.50000000000000 19)" fill="rgb(128,134,139)" fill-rule="evenodd" stroke="none" stroke-width="1"><![CDATA[
+ Buf #0
+ ]]></text></g></g><polyline id="ec4qhmsv5c9j23" points="280,60 300,60 300,77.520000 313.630000,77.510000" fill="none" fill-rule="evenodd" stroke="rgb(128,134,139)" stroke-width="1"/><polygon id="ec4qhmsv5c9j24" points="318.880000,77.500000 311.890000,81.010000 313.630000,77.510000 311.880000,74.010000" fill="rgb(128,134,139)" stroke="rgb(128,134,139)" stroke-width="1"/><g id="ec4qhmsv5c9j25_ts" transform="translate(79.984375,75) scale(1,1)"><rect id="ec4qhmsv5c9j25" width="140" height="30" rx="0" ry="0" transform="translate(-70,-15)" fill="rgb(220,237,200)" stroke="none" stroke-width="1"/></g><text id="ec4qhmsv5c9j26" dx="0" dy="0" font-family="RobotoMono-Regular, "Roboto Mono"" font-size="14" transform="matrix(1 0 0 1 17 80.43749999999999)" fill="rgb(95,99,104)" fill-rule="evenodd" stroke="none" stroke-width="1"><![CDATA[
+ Data source 1
+ ]]></text><text id="ec4qhmsv5c9j27" dx="0" dy="0" font-family="RobotoMono-Regular, "Roboto Mono"" font-size="14" transform="matrix(1 0 0 1 17 111.96093750000000)" fill="rgb(95,99,104)" fill-rule="evenodd" stroke="none" stroke-width="1"><![CDATA[
+ Data source 2
+ ]]></text><rect id="ec4qhmsv5c9j28" width="80" height="80" rx="0" ry="0" transform="matrix(-1 0 -0 -1 280 80.00000000000003)" fill="rgb(245,245,245)" stroke="none" stroke-width="1"/><rect id="ec4qhmsv5c9j29" width="10" height="40" rx="0" ry="0" transform="matrix(-1 0 -0 -1 230 75.00000000000003)" fill="rgb(255,255,255)" stroke="rgb(154,160,166)" stroke-width="1"/><rect id="ec4qhmsv5c9j30" width="10" height="40" rx="0" ry="0" transform="matrix(-1 0 -0 -1 239.99218750000000 75.00000000000003)" fill="rgb(255,255,255)" stroke="rgb(154,160,166)" stroke-width="1"/><rect id="ec4qhmsv5c9j31" width="10" height="40" rx="0" ry="0" transform="matrix(-1 0 -0 -1 250 75.00000000000003)" fill="rgb(255,255,255)" stroke="rgb(154,160,166)" stroke-width="1"/><rect id="ec4qhmsv5c9j32" width="10" height="40" rx="0" ry="0" transform="matrix(-1 0 -0 -1 260 75.00000000000003)" fill="rgb(255,255,255)" stroke="rgb(154,160,166)" stroke-width="1"/><line id="ec4qhmsv5c9j33" x1="160" y1="65" x2="193.630000" y2="65" fill="none" fill-rule="evenodd" stroke="rgb(128,134,139)" stroke-width="1"/><polygon id="ec4qhmsv5c9j34" points="198.880000,65 191.880000,68.500000 193.630000,65 191.880000,61.500000" fill="rgb(128,134,139)" stroke="rgb(128,134,139)" stroke-width="1"/><g id="ec4qhmsv5c9j35" transform="matrix(-1 0 -0 -1 469.98437500000000 219.99999999999997)"><polygon id="ec4qhmsv5c9j36" points="165.500000,117.780000 165.500000,102.220000 296.670000,102.220000 296.670000,96.940000 314.500000,110 296.670000,123.060000 296.670000,117.780000" transform="matrix(-0.89533244155904 0 -0 -1 441.56642786531881 219.99999999999997)" fill="rgb(245,245,245)" stroke="none" stroke-width="1"/><polygon id="ec4qhmsv5c9j37" points="165.500000,117.780000 165.500000,102.220000 296.670000,102.220000 296.670000,96.940000 314.500000,110 296.670000,123.060000 296.670000,117.780000" transform="matrix(0.89533244155904 0 0 1 27.57653802468090 0.05468750000000)" fill="rgb(245,245,245)" stroke="none" stroke-width="1"/><rect id="ec4qhmsv5c9j38" width="80" height="80" rx="0" ry="0" transform="matrix(-1.46420418416810 0 -0 -0.19473433688385 293.06746650343666 117.79657534053530)" fill="rgb(245,245,245)" stroke="none" stroke-width="1"/></g><g id="ec4qhmsv5c9j39" transform="matrix(1 0 0 1 205.50000000000000 102.50000000000000)"><g id="ec4qhmsv5c9j40"><text id="ec4qhmsv5c9j41" dx="0" dy="0" font-family="RobotoMono-Regular, "Roboto Mono"" font-size="10" transform="matrix(1 0 0 1 1.49218750000000 11.44531250000000)" fill="rgb(95,99,104)" fill-rule="evenodd" stroke="none" stroke-width="1"><![CDATA[
+ IPC Channel
+ ]]></text></g></g><rect id="ec4qhmsv5c9j42" width="40" height="20" rx="0" ry="0" transform="matrix(1 0 0 1 340 110)" fill="none" fill-rule="evenodd" stroke="none" stroke-width="1"/><rect id="ec4qhmsv5c9j43" width="40" height="20" rx="0" ry="0" transform="matrix(1 0 0 1 180 130)" fill="none" fill-rule="evenodd" stroke="none" stroke-width="1"/><text id="ec4qhmsv5c9j44" dx="0" dy="0" font-family="RobotoMono-Regular, "Roboto Mono"" font-size="18" transform="matrix(1 0 0 1 36.78125000000000 31)" fill="rgb(117,121,127)" fill-rule="evenodd" stroke="none" stroke-width="1"><![CDATA[
+ Producer
+ ]]></text><text id="ec4qhmsv5c9j45" dx="0" dy="0" font-family="RobotoMono-Regular, "Roboto Mono"" font-size="18" transform="matrix(1 0 0 1 212.98437500000000 24)" fill="rgb(106,110,116)" fill-rule="evenodd" stroke="none" stroke-width="1"><![CDATA[
+ shmem
+ ]]></text><text id="ec4qhmsv5c9j46" dx="0" dy="0" font-family="RobotoMono-Regular, "Roboto Mono"" font-size="18" transform="matrix(1 0 0 1 340 36.98437500000000)" fill="rgb(106,110,116)" fill-rule="evenodd" stroke="none" stroke-width="1"><![CDATA[
+ Tracing service
+ ]]></text></g><circle id="ec4qhmsv5c9j47" r="7" transform="matrix(1 0 0 1 138 75)" fill="rgb(96,125,139)" fill-rule="evenodd" stroke="none" stroke-width="1"/><g id="ec4qhmsv5c9j48_to" transform="translate(0,0)"><g id="ec4qhmsv5c9j48" transform="translate(0,0)"><g id="ec4qhmsv5c9j49_ts" transform="translate(225,68) scale(0,0)"><circle id="ec4qhmsv5c9j49" r="3" transform="translate(-0,0)" fill="rgb(96,125,139)" fill-rule="evenodd" stroke="none" stroke-width="1"/></g><g id="ec4qhmsv5c9j50_ts" transform="translate(225,41) scale(0,0)"><circle id="ec4qhmsv5c9j50" r="3" transform="translate(0,0)" fill="rgb(96,125,139)" fill-rule="evenodd" stroke="none" stroke-width="1"/></g><g id="ec4qhmsv5c9j51_ts" transform="translate(225,50) scale(0,0)"><circle id="ec4qhmsv5c9j51" r="3" transform="translate(0,0)" fill="rgb(96,125,139)" fill-rule="evenodd" stroke="none" stroke-width="1"/></g><g id="ec4qhmsv5c9j52_ts" transform="translate(225,59) scale(0,0)"><circle id="ec4qhmsv5c9j52" r="3" transform="translate(0,0)" fill="rgb(96,125,139)" fill-rule="evenodd" stroke="none" stroke-width="1"/></g></g></g><g id="ec4qhmsv5c9j53_to" transform="translate(0,0)"><g id="ec4qhmsv5c9j53" transform="translate(0,0)"><g id="ec4qhmsv5c9j54_ts" transform="translate(245,41) scale(0,0)"><circle id="ec4qhmsv5c9j54" r="3" transform="translate(0,0)" fill="rgb(96,125,139)" fill-rule="evenodd" stroke="none" stroke-width="1"/></g><g id="ec4qhmsv5c9j55_ts" transform="translate(245,50) scale(0,0)"><circle id="ec4qhmsv5c9j55" r="3" transform="translate(0,0)" fill="rgb(96,125,139)" fill-rule="evenodd" stroke="none" stroke-width="1"/></g><g id="ec4qhmsv5c9j56_ts" transform="translate(245,59) scale(0,0)"><circle id="ec4qhmsv5c9j56" r="3" transform="translate(0,0)" fill="rgb(96,125,139)" fill-rule="evenodd" stroke="none" stroke-width="1"/></g></g></g><rect id="ec4qhmsv5c9j57" width="13" height="13" rx="0" ry="0" transform="matrix(1 0 0 1 131 100)" fill="rgb(96,125,139)" fill-rule="evenodd" stroke="none" stroke-width="1"/><g id="ec4qhmsv5c9j58_to" transform="translate(0,0)"><g id="ec4qhmsv5c9j58" transform="translate(0,0)"><g id="ec4qhmsv5c9j59_ts" transform="translate(234.992188,41) scale(0,0)"><rect id="ec4qhmsv5c9j59" width="6" height="6" rx="0" ry="0" transform="translate(-2.992188,-3)" fill="rgb(96,125,139)" fill-rule="evenodd" stroke="none" stroke-width="1"/></g><g id="ec4qhmsv5c9j60_ts" transform="translate(234.992188,50) scale(0,0)"><rect id="ec4qhmsv5c9j60" width="6" height="6" rx="0" ry="0" transform="translate(-2.992188,-3)" fill="rgb(96,125,139)" fill-rule="evenodd" stroke="none" stroke-width="1"/></g><g id="ec4qhmsv5c9j61_ts" transform="translate(234.992188,59) scale(0,0)"><rect id="ec4qhmsv5c9j61" width="6" height="6" rx="0" ry="0" transform="translate(-2.992187,-3)" fill="rgb(96,125,139)" fill-rule="evenodd" stroke="none" stroke-width="1"/></g><g id="ec4qhmsv5c9j62_ts" transform="translate(234.992188,68) scale(0,0)"><rect id="ec4qhmsv5c9j62" width="6" height="6" rx="0" ry="0" transform="translate(-2.992188,-3)" fill="rgb(96,125,139)" fill-rule="evenodd" stroke="none" stroke-width="1"/></g></g></g><g id="ec4qhmsv5c9j63_to" transform="translate(0,0)"><g id="ec4qhmsv5c9j63" transform="translate(0,0)"><g id="ec4qhmsv5c9j64_ts" transform="translate(255,41) scale(0,0)"><rect id="ec4qhmsv5c9j64" width="6" height="6" rx="0" ry="0" transform="translate(-3,-3)" fill="rgb(96,125,139)" fill-rule="evenodd" stroke="none" stroke-width="1"/></g><g id="ec4qhmsv5c9j65_ts" transform="translate(255,50) scale(0,0)"><rect id="ec4qhmsv5c9j65" width="6" height="6" rx="0" ry="0" transform="translate(-3,-3)" fill="rgb(96,125,139)" fill-rule="evenodd" stroke="none" stroke-width="1"/></g><g id="ec4qhmsv5c9j66_ts" transform="translate(255,59) scale(0,0)"><rect id="ec4qhmsv5c9j66" width="6" height="6" rx="0" ry="0" transform="translate(-3,-3)" fill="rgb(96,125,139)" fill-rule="evenodd" stroke="none" stroke-width="1"/></g></g></g></g><g id="ec4qhmsv5c9j67_ts" transform="translate(239.133524,134.619247) scale(0,0)"><g id="ec4qhmsv5c9j67" transform="translate(-49.981785,-50)"><line id="ec4qhmsv5c9j68" x1="43.250000" y1="40.750000" x2="43.250000" y2="59.250000" fill="none" stroke="rgb(84,131,204)" stroke-width="7" stroke-linecap="round" stroke-linejoin="round"/><line id="ec4qhmsv5c9j69" x1="56.750000" y1="40.750000" x2="56.750000" y2="59.250000" fill="none" stroke="rgb(84,131,204)" stroke-width="7" stroke-linecap="round" stroke-linejoin="round"/><circle id="ec4qhmsv5c9j70" r="25" transform="matrix(1 0 0 1 50 50)" fill="none" stroke="rgb(84,110,122)" stroke-width="7" stroke-linecap="round" stroke-linejoin="round"/><rect id="ec4qhmsv5c9j71" width="48" height="48" rx="6.220000" ry="6.220000" transform="matrix(0.54239151367153 0 0 0.55299458693109 36.96438910975433 36.75852079295539)" fill="rgb(221,44,0)" stroke="none" stroke-width="1"/></g></g><g id="ec4qhmsv5c9j72" transform="matrix(2.18484486164398 0 0 2.01568168230577 130.75775692000002 -23.26408411500005)" opacity="0.42"><circle id="ec4qhmsv5c9j73" r="25" transform="matrix(1 0 0 1 50 50)" fill="none" stroke="rgb(84,131,204)" stroke-width="7" stroke-linecap="round" stroke-linejoin="round"/><path id="ec4qhmsv5c9j74" d="M62.850000,48L46.340000,36C45.591947,35.450677,44.597719,35.371193,43.771894,35.794693C42.946069,36.218193,42.430434,37.071966,42.440000,38L42.440000,62.070000C42.430434,62.998034,42.946069,63.851807,43.771894,64.275307C44.597719,64.698807,45.591947,64.619323,46.340000,64.070000L62.850000,52C63.499062,51.540757,63.884903,50.795101,63.884903,50C63.884903,49.204899,63.499062,48.459243,62.850000,48Z" fill="rgb(84,131,204)" stroke="none" stroke-width="1"/></g></svg>
\ No newline at end of file
diff --git a/docs/images/gpu-counters.png b/docs/images/gpu-counters.png
new file mode 100644
index 0000000..ac08d31
--- /dev/null
+++ b/docs/images/gpu-counters.png
Binary files differ
diff --git a/docs/images/java-flamegraph-focus.png b/docs/images/java-flamegraph-focus.png
new file mode 100644
index 0000000..d75648f
--- /dev/null
+++ b/docs/images/java-flamegraph-focus.png
Binary files differ
diff --git a/docs/images/java-flamegraph.png b/docs/images/java-flamegraph.png
new file mode 100644
index 0000000..fa58843
--- /dev/null
+++ b/docs/images/java-flamegraph.png
Binary files differ
diff --git a/docs/images/latency.png b/docs/images/latency.png
new file mode 100644
index 0000000..7732ec2
--- /dev/null
+++ b/docs/images/latency.png
Binary files differ
diff --git a/docs/images/lmk_lmkd.png b/docs/images/lmk_lmkd.png
new file mode 100644
index 0000000..b7dc6be
--- /dev/null
+++ b/docs/images/lmk_lmkd.png
Binary files differ
diff --git a/docs/images/metrics-summary.png b/docs/images/metrics-summary.png
new file mode 100644
index 0000000..4603f60
--- /dev/null
+++ b/docs/images/metrics-summary.png
Binary files differ
diff --git a/docs/images/native-flamegraph-focus.png b/docs/images/native-flamegraph-focus.png
new file mode 100644
index 0000000..bfcdee1
--- /dev/null
+++ b/docs/images/native-flamegraph-focus.png
Binary files differ
diff --git a/docs/images/native-flamegraph.png b/docs/images/native-flamegraph.png
new file mode 100644
index 0000000..88b92e3
--- /dev/null
+++ b/docs/images/native-flamegraph.png
Binary files differ
diff --git a/docs/images/oom-score.png b/docs/images/oom-score.png
new file mode 100644
index 0000000..15612a0
--- /dev/null
+++ b/docs/images/oom-score.png
Binary files differ
diff --git a/docs/images/oop-table-inheritance.png b/docs/images/oop-table-inheritance.png
new file mode 100644
index 0000000..c757c8e
--- /dev/null
+++ b/docs/images/oop-table-inheritance.png
Binary files differ
diff --git a/docs/images/perfetto-stack.png b/docs/images/perfetto-stack.png
new file mode 100644
index 0000000..39ba198
--- /dev/null
+++ b/docs/images/perfetto-stack.png
Binary files differ
diff --git a/docs/images/perfetto-stack.svg b/docs/images/perfetto-stack.svg
new file mode 100644
index 0000000..57c1f56
--- /dev/null
+++ b/docs/images/perfetto-stack.svg
@@ -0,0 +1,3 @@
+<?xml version="1.0" encoding="UTF-8"?>
+<!DOCTYPE svg PUBLIC "-//W3C//DTD SVG 1.1//EN" "http://www.w3.org/Graphics/SVG/1.1/DTD/svg11.dtd">
+<svg xmlns="http://www.w3.org/2000/svg" xmlns:xlink="http://www.w3.org/1999/xlink" version="1.1" width="1651px" height="777px" viewBox="-0.5 -0.5 1651 777" content="<mxfile host="app.diagrams.net" modified="2020-05-19T16:09:27.725Z" agent="5.0 (Macintosh; Intel Mac OS X 10_15_3) AppleWebKit/537.36 (KHTML, like Gecko) Chrome/81.0.4044.138 Safari/537.36" etag="264vm5GKuPUnRBTbznFr" version="13.1.1" type="device"><diagram id="7NN0wUOKmaAmGsXKK3Xs" name="Page-1">7VxZc6pOFv80qZp50Go2l0fikpgRkxvNzU1ephBaxADNH3DBTz+n2VQERcUkcyuppAKH7qY553e6zwY3XMtc3TmyPZWIio0bFqmrG659w7JMXWDgH6X4EUXg+ZCiOboa0TaEob7GIZEVIupcV7G709AjxPB0e5eoEMvCirdDkx2HLHebTYixe1db1vAeYajIxj71VVe9aURtsmhz4R7r2jS+NYuiK6Yct44I7lRWyXKHhFdel1heNMdnMiYeuRE6U8+jjyfesF34ndAWVY0QzcCyrbtVhZhAVlxo0p3Ipm5Q5kadYViuc8O1HEK88MhctbBBpRLzO7x3N+dq8sAOtrwiHQYfK8n5j/O0lgz3QVgsSX1+X4mEvJCNecTIZ6wQR6Xic2QFJBqyxPNjRk90w2gRgzjBKTdpTMYT7oa7dT2HfOD4ikUsaH9LWdJNPTl3Kxu6ZgFBgZljh/a1ZUW3tD6e0CdBUccIZFwNzhfY8XSQthh19Yi96TeiJ20WbShbo2zNlWs0OlwL6NFDw5h4lctNJpERaA0mJvYcH5rEHWL4xAoTK8Jyg75m3Ga6Bbx6TJQjNGnJ2BvhwUEkvxNkyTX2hHnD1gwvYgTVKpBocKH2z5zC7taJwBif74g6JtLOFTcQBiAdcay9CppuOtW06H9wM5CBddFAPasi23YEQSrNaGDgSjj27v0i1duQU4hdTnUPD+3w2Zew/kGjqWcCb9sMndUWoCPYXg/L7D4q68qY4yndkMfYuJWVD80hc0tN3T5bA0pAcj2F5GRh3EIyl4Xk2tWQLGQAOSVUyiM79+mjXUYex83RqVwRUlwR9pnCZDGFuRpT2ONMgVFgv6VoOYJ52bXDTXiir7CaUgLAJK/IEwHlaUIh0OULdp/nX8dU7jhTwRyw6aFuBiZIooh9qq5PxNU9nVCFhAXBgw0/V4/pZhn85CrznlSCW4oxFcUUOFZlT4ZVNDyFZXEBi+TtCuTLtp7uB+y7f8uPX1dzZY10+f4ZKW2y6HMqp/oCJ/nCQjGVhTQTl1KruVZNRe/dv9vvf9TWmNOavZmoSS3RHwR/Pe3dNNxxG9jITm317gXaqvb7/TN5GvZWj/e3fE+/Je+vhiXf/4K+HV651/Sn2Wr59ueZ9O6A9oGWvfYtkWbPLPz1pO7bEuubccdmc/4+7C1SfVaPLRGpsy7pjx5eB3fSsj/kmcEQzQftF08aolV/1O09vkpef/bC9Noi0MTomriCfr2B8Ybe1mJwHfqiQdCn40l/pFTbDgvttKDd7BeM1dEoXVl3vOgc+rx50qvmw7gz4M18MHqh/YN2vXaXDEyJ0ijfVuG9RDo/Fv6IZL2tjo7/u9hc8QfioT03bL/D2A90bB+baNkfPfcGFszRpHN8qI1HojfoaOzvmRq3WcHceLmFfFVHvtx+YCXL9qQWQnm0pK9OZbNcKNy79UQtq+AXTAdPjpDfRNdYFOJRGrt2VmNvHa7xGXsTf6UFo5ZrYx02e2L7nxo+Tmw8BI5Otk0UXQgHo1cs4piysXVtGT0uvcijUATIwB6YIZXEDE73BOF4Fd1SA4nQiyi+X3AFDC7LnUD7uGe03qMl+AS7oyYdJwaRvXR7VXdtQ46eV7cMPbqQNvWGvuth8JJqsklXQGvs2ruWXZbB98PpMzh9zJb+MZovcf8KG83C1UyZ5l/i/bWmDnDkx/v7HCDz38/7Y5gz99gNuNgGgGsPWW1qNENvMneCyFY45tg5f8Qj2IwU7/jgKGvwvm7NgdwVLdUhwLHyAQ/4a7c67VbjEOq3GjNjAbMoVxu2oM42MkCbeEhlLMBxvC3GbX0//pY47du45c7A7YuLncfxjLphsPFTRT0TlkLOmheJGk2CoOvBPRo2+I/47l2VKC79B8CuJLDuKva84ipTrM6NYP1kj2ocu8XrSEXPRlRL6DCiUD6ihAxEmbqqGoVDEkcQJeyuhFzGSshmb+knAwpOtzBVCGOF15I8jME9bYcoNzQWlrOSlIRmmxgGdtxLYWxikzh+RYHt0AuGO45j7gfH+zjOWhm/DscXo+seyzQ3AFgGgZUAM0v29AWuTGHYSjxoEazxP1jbwxrP16qN/QjN/8GyydWyTLBR7IIguPdt8Iv6+tiR6TQ35uMRjyQkq/qiXPswsQtRkH9GsRERnkmy8jhMzl51S6U59sNTpMqxPcs8DdItwOncBJCEIUC2G/lqFVf9KKI79RJ1R1WwqpRvwQbOWq7u7GSeC4c/TzNp6xkGSCPLpD0nPZKhSgXTUGjPOxMt2fCBaS32RixaNjCZcDg3wXSOL7xfC3BcxLWbIxUD3W6zgcoSL0rJN6tkgMuS7/VKBtgsV/uTM61MehP5BqnWz8y1JhgrOdeax/YvZOtPtvX7ZluH4nrY/j3rjzpzaSgu+6Oe1p99eJIu+uqsQ7OTmjTkV0DTKK3XfiDS6HlGab02XNPRHMbwg2ztq7QMx6E0BLSeJ1n24LElrgbsdsZ2k81VdcQkGdDZLwb6a5SurDtakjX988YkmdQky0rptgf8W775KMrCotUmi9p9fUyyxyEtzOhKq14rHKPX7rK0DZzHGebg3kCvjUe/NOkud85+gTn72XMmen/NN/oc4GfNU8ReQ9k/O4lalveXb47TzMCTQ8DGcIlz0Ag/PXVYssV9smcqU0PK1d3IoMbUH40f9KhRzZbpkE4mGI3ZgkZ1R2zU0PlGdZ79VorNxXPVeipSzDSqGSERjmGrQoaX2mCqsZ32GeY1l2V6nOHKXjuzHWW+giR7OMZ1kt5pFfytu3O49xofqBm4JKj5VzHv8ooBfDi8dvb60ml0UbeTt75krxCHvcK0X5e9Fu2sMlyGx8eDi93lS1p90snVq3p8142EPWFnAtAm0OCld3Ls67Jt934k9ZN99WFYcFvdfTljrlft6BGqKl4U2E+5MpMJYqd12xWLBqnEOihIkf00M816zf2UT6ddczbTzIDvZ2+l+y+3fH5wQ0gx7OuDG1yB6vryCsnj5bTk4AbHZ7P9C9maVRn6E9woO7jhw3ho2H7OC1T42YGK9+xAhZkdqKBOOi2lfvNpQEBcUkd+49BLm7JtaBcETYZhO1qyHQUCaIAhKdvuj2ggQdMGHxqTE6RYbwcQ5PZ0FgUctKj8OywZ99PBiTdNutM8ycwOUCj+VsDjtdjzROXkpD+aFnku8ni3KX3fCqisrxjsyFP+71kxzu4XZsZxDN20ieNt5bD3DarLLKcnB0yG8XwCuhyYTo+D8Mj13eOVRmcbO91uq9XIjWinjB1ZYZrFggeZxk6p2WxUE6o1bgc9mdUTtY3Rc+nmUlrZT2Z9YgC0ylh2MQ1a0bnoygGw5Vjvl6WpQ9RF1vsGkBGhNfx9sLDxSJgseaTj5jwq0Zz/mxBeuzLCTyjaGP6ift4/cxzMGVsaDU3kovUyWN5GSkHLFxDcGMR/CRDdf4xK4CgUwiLzg8VMLAoZAZIrY7HgdxLya9ILw5A/XGEE81roygG8FzUFmMwAjkRm5EhypMCGcJFdIGNVaDBFgyDFq9z4KyM1HfSoZVUGZ4bxTo92FITj5VmCbDiGL99UqJ+oT3RlHxm7xZPXQMmV6rk+HSWF30hgv9JszERBz4ozj/sASJYp5E0dLKsnb5pHigc5Pbl5xSQqLrCd8mVmPv9fF6n6Jy5SJ5h0m/1NlbFJrPy9pihks7e3l0HvD+1NlA/snYxJhVgKtr3AkAvxHWDPKAI+4Qd8e6Wrnwy+gptmgQgttlSRfo1sw3RVdqc0ghqIa1tyhWod8t72xCvd+3MTBmLp8dvWcXu1feLHJxawhXapoCpimJgSdKzWm3xM2PQOzuLuu4CCqTTGCsfLQbv4c25M2FB2vG1CMM4TdnQQDH3HNRgOGmnYS6jDpIg2/ApXYB/kXZ3NTTvm0WZq8VfbmASRWN375FsKj/G7nAeEHgXfwvkea3cwn5AF35jmYCN4i2RnblmYju7wRPRgscv5BBOftggihoa9NpqxP1D63Z/0SxaR3NIDBSqWPPYFdmn9R8W+mYoxwkUq9l1Ugmk2q9x5SlFr1qr13e2pLsSUixWjmCW+cfY/KNsXOJigcexVostCXKNnsdX5b+d3ZzD6V7Va/feRMG9B97+4Tf9RCR60SESML7PY4m/xIIUMK0r4civq6Fcmz3Q6Rdv+iTuU4PhdNe5Q8PuN+++InVC6fdmi94rHcE10XWyODf86UKnVmu1urSBUkkqNbxBy54u8G579iiFXZdhrweVYcD1aINq0epUs6OvZCMT8Mjxl6yoDW10KW3TV77H8NdDKTOWUCC043Xw7OzTTNp825zr/Aw==</diagram></mxfile>"><defs><style type="text/css">@import url(https://fonts.googleapis.com/css?family=Roboto);
</style></defs><g><rect x="0" y="75" width="900" height="700" fill="#f8fbf3" stroke="none" pointer-events="all"/><g fill="#388E3C" font-family="Roboto" text-anchor="middle" font-size="36px"><text x="449.5" y="134.5">Record traces</text></g><rect x="600" y="150" width="300" height="600" fill="none" stroke="none" pointer-events="all"/><g transform="translate(-0.5 -0.5)"><switch><foreignObject style="overflow: visible; text-align: left;" pointer-events="none" width="100%" height="100%" requiredFeatures="http://www.w3.org/TR/SVG11/feature#Extensibility"><div xmlns="http://www.w3.org/1999/xhtml" style="display: flex; align-items: unsafe flex-start; justify-content: unsafe center; width: 298px; height: 1px; padding-top: 157px; margin-left: 601px;"><div style="box-sizing: border-box; font-size: 0; text-align: center; "><div style="display: inline-block; font-size: 32px; font-family: Roboto; color: #7cb342; line-height: 1.2; pointer-events: all; white-space: normal; word-wrap: normal; "><font face="roboto" style="font-size: 32px"><span style="font-size: 32px">In-app tracing</span></font></div></div></div></foreignObject><text x="750" y="189" fill="#7cb342" font-family="Roboto" font-size="32px" text-anchor="middle">In-app tracing</text></switch></g><ellipse cx="450" cy="50" rx="50" ry="50" fill="#4caf50" stroke="none" pointer-events="all"/><image x="417.5" y="17.5" width="64" height="64" xlink:href="data:image/svg+xml;base64,PHN2ZyB4bWxucz0iaHR0cDovL3d3dy53My5vcmcvMjAwMC9zdmciIHZpZXdCb3g9IjAgMCAyNCAyNCIgZmlsbD0id2hpdGUiIHdpZHRoPSIxOHB4IiBoZWlnaHQ9IjE4cHgiPjxwYXRoIGQ9Ik0wIDBoMjR2MjRIMFYweiIgZmlsbD0ibm9uZSIvPjxwYXRoIGQ9Ik0xOCA0djFoLTJWNGMwLS41NS0uNDUtMS0xLTFIOWMtLjU1IDAtMSAuNDUtMSAxdjFINlY0YzAtLjU1LS40NS0xLTEtMXMtMSAuNDUtMSAxdjE2YzAgLjU1LjQ1IDEgMSAxczEtLjQ1IDEtMXYtMWgydjFjMCAuNTUuNDUgMSAxIDFoNmMuNTUgMCAxLS40NSAxLTF2LTFoMnYxYzAgLjU1LjQ1IDEgMSAxczEtLjQ1IDEtMVY0YzAtLjU1LS40NS0xLTEtMXMtMSAuNDUtMSAxek04IDE3SDZ2LTJoMnYyem0wLTRINnYtMmgydjJ6bTAtNEg2VjdoMnYyem0xMCA4aC0ydi0yaDJ2MnptMC00aC0ydi0yaDJ2MnptMC00aC0yVjdoMnYyeiIvPjwvc3ZnPg==" preserveAspectRatio="none" transform="rotate(90,450,50)"/><rect x="0" y="150" width="300" height="500" fill="none" stroke="none" pointer-events="all"/><g transform="translate(-0.5 -0.5)"><switch><foreignObject style="overflow: visible; text-align: left;" pointer-events="none" width="100%" height="100%" requiredFeatures="http://www.w3.org/TR/SVG11/feature#Extensibility"><div xmlns="http://www.w3.org/1999/xhtml" style="display: flex; align-items: unsafe flex-start; justify-content: unsafe center; width: 298px; height: 1px; padding-top: 157px; margin-left: 1px;"><div style="box-sizing: border-box; font-size: 0; text-align: center; "><div style="display: inline-block; font-size: 32px; font-family: Roboto; color: #7cb342; line-height: 1.2; pointer-events: all; white-space: normal; word-wrap: normal; "><span style="font-family: "roboto" ; font-size: 32px ; font-style: normal ; font-weight: 400 ; letter-spacing: normal ; text-indent: 0px ; text-transform: none ; word-spacing: 0px ; float: none ; display: inline">System </span><span style="font-family: "roboto" ; font-size: 32px ; font-style: normal ; font-weight: 400 ; letter-spacing: normal ; text-indent: 0px ; text-transform: none ; word-spacing: 0px ; float: none ; display: inline">tracing</span></div></div></div></foreignObject><text x="150" y="189" fill="#7cb342" font-family="Roboto" font-size="32px" text-anchor="middle">System tracing</text></switch></g><rect x="300" y="150" width="300" height="600" fill="none" stroke="none" pointer-events="all"/><g transform="translate(-0.5 -0.5)"><switch><foreignObject style="overflow: visible; text-align: left;" pointer-events="none" width="100%" height="100%" requiredFeatures="http://www.w3.org/TR/SVG11/feature#Extensibility"><div xmlns="http://www.w3.org/1999/xhtml" style="display: flex; align-items: unsafe flex-start; justify-content: unsafe center; width: 298px; height: 1px; padding-top: 157px; margin-left: 301px;"><div style="box-sizing: border-box; font-size: 0; text-align: center; "><div style="display: inline-block; font-size: 32px; font-family: Roboto; color: #7cb342; line-height: 1.2; pointer-events: all; white-space: normal; word-wrap: normal; "><font face="roboto" style="font-size: 32px"><span style="font-size: 32px">Chrome tracing</span></font></div></div></div></foreignObject><text x="450" y="189" fill="#7cb342" font-family="Roboto" font-size="32px" text-anchor="middle">Chrome tracing</text></switch></g><rect x="25" y="225" width="250" height="300" fill="#dcedc8" stroke="none" pointer-events="all"/><g transform="translate(-0.5 -0.5)"><switch><foreignObject style="overflow: visible; text-align: left;" pointer-events="none" width="100%" height="100%" requiredFeatures="http://www.w3.org/TR/SVG11/feature#Extensibility"><div xmlns="http://www.w3.org/1999/xhtml" style="display: flex; align-items: unsafe flex-end; justify-content: unsafe center; width: 248px; height: 1px; padding-top: 522px; margin-left: 26px;"><div style="box-sizing: border-box; font-size: 0; text-align: center; "><div style="display: inline-block; font-size: 28px; font-family: Roboto; color: #1b5e20; line-height: 1.2; pointer-events: all; white-space: normal; word-wrap: normal; "><span style="font-size: 28px">Data sources<br style="font-size: 28px" /></span><font style="font-size: 20px">Linux/Android</font></div></div></div></foreignObject><text x="150" y="522" fill="#1b5e20" font-family="Roboto" font-size="28px" text-anchor="middle">Data sources...</text></switch></g><a target="_top" xlink:href="/docs/data-sources/cpu-scheduling"><rect x="50" y="250" width="200" height="50" fill="#c5e1a5" stroke="none" pointer-events="all"/><g transform="translate(-0.5 -0.5)"><switch><foreignObject style="overflow: visible; text-align: left;" pointer-events="none" width="100%" height="100%" requiredFeatures="http://www.w3.org/TR/SVG11/feature#Extensibility"><div xmlns="http://www.w3.org/1999/xhtml" style="display: flex; align-items: unsafe center; justify-content: unsafe center; width: 198px; height: 1px; padding-top: 275px; margin-left: 51px;"><div style="box-sizing: border-box; font-size: 0; text-align: center; "><div style="display: inline-block; font-size: 25px; font-family: Roboto; color: #1b5e20; line-height: 1.2; pointer-events: all; white-space: normal; word-wrap: normal; "><span style="font-size: 25px">Linux ftrace</span></div></div></div></foreignObject><text x="150" y="283" fill="#1b5e20" font-family="Roboto" font-size="25px" text-anchor="middle">Linux ftrace</text></switch></g></a><a target="_top" xlink:href="/docs/data-sources/memory-counters"><rect x="50" y="325" width="200" height="50" fill="#c5e1a5" stroke="none" pointer-events="all"/><g transform="translate(-0.5 -0.5)"><switch><foreignObject style="overflow: visible; text-align: left;" pointer-events="none" width="100%" height="100%" requiredFeatures="http://www.w3.org/TR/SVG11/feature#Extensibility"><div xmlns="http://www.w3.org/1999/xhtml" style="display: flex; align-items: unsafe center; justify-content: unsafe center; width: 198px; height: 1px; padding-top: 350px; margin-left: 51px;"><div style="box-sizing: border-box; font-size: 0; text-align: center; "><div style="display: inline-block; font-size: 25px; font-family: Roboto; color: #1b5e20; line-height: 1.2; pointer-events: all; white-space: normal; word-wrap: normal; "><font style="font-size: 25px">/proc </font><span style="font-size: 25px">pollers</span></div></div></div></foreignObject><text x="150" y="358" fill="#1b5e20" font-family="Roboto" font-size="25px" text-anchor="middle">/proc pollers</text></switch></g></a><a target="_top" xlink:href="/docs/data-sources/native-heap-profiler"><rect x="50" y="396.88" width="200" height="50" fill="#c5e1a5" stroke="none" pointer-events="all"/><g transform="translate(-0.5 -0.5)"><switch><foreignObject style="overflow: visible; text-align: left;" pointer-events="none" width="100%" height="100%" requiredFeatures="http://www.w3.org/TR/SVG11/feature#Extensibility"><div xmlns="http://www.w3.org/1999/xhtml" style="display: flex; align-items: unsafe center; justify-content: unsafe center; width: 198px; height: 1px; padding-top: 422px; margin-left: 51px;"><div style="box-sizing: border-box; font-size: 0; text-align: center; "><div style="display: inline-block; font-size: 25px; font-family: Roboto; color: #1b5e20; line-height: 1.2; pointer-events: all; white-space: normal; word-wrap: normal; "><span style="font-size: 25px">Heap profilers</span></div></div></div></foreignObject><text x="150" y="429" fill="#1b5e20" font-family="Roboto" font-size="25px" text-anchor="middle">Heap profilers</text></switch></g></a><a target="_top" xlink:href="/docs/instrumentation/tracing-sdk"><rect x="25" y="650" width="850" height="100" fill="#dcedc8" stroke="none" pointer-events="all"/><g transform="translate(-0.5 -0.5)"><switch><foreignObject style="overflow: visible; text-align: left;" pointer-events="none" width="100%" height="100%" requiredFeatures="http://www.w3.org/TR/SVG11/feature#Extensibility"><div xmlns="http://www.w3.org/1999/xhtml" style="display: flex; align-items: unsafe center; justify-content: unsafe center; width: 848px; height: 1px; padding-top: 700px; margin-left: 26px;"><div style="box-sizing: border-box; font-size: 0; text-align: center; "><div style="display: inline-block; font-size: 32px; font-family: Roboto; color: #1b5e20; line-height: 1.2; pointer-events: all; white-space: normal; word-wrap: normal; "><font style="font-size: 36px">Tracing C++ Library<br /></font><div><font style="font-size: 20px">Android / Linux / MacOS / Windows</font></div></div></div></div></foreignObject><text x="450" y="710" fill="#1b5e20" font-family="Roboto" font-size="32px" text-anchor="middle">Tracing C++ Library...</text></switch></g></a><rect x="925" y="75" width="350" height="700" fill="#fff3e0" stroke="none" pointer-events="all"/><g fill="#FF9800" font-family="Roboto" text-anchor="middle" font-size="36px"><text x="1099.5" y="134.5">Analyze traces</text></g><ellipse cx="1100" cy="50" rx="50" ry="50" fill="#ff9800" stroke="none" pointer-events="all"/><image x="1067.5" y="17.5" width="64" height="64" xlink:href="data:image/svg+xml;base64,PHN2ZyB4bWxucz0iaHR0cDovL3d3dy53My5vcmcvMjAwMC9zdmciIHZpZXdCb3g9IjAgMCAyNCAyNCIgZmlsbD0id2hpdGUiIHdpZHRoPSIxOHB4IiBoZWlnaHQ9IjE4cHgiPjxwYXRoIGQ9Ik0wIDBoMjR2MjRIMFYweiIgZmlsbD0ibm9uZSIvPjxwYXRoIGQ9Ik0xOSAzSDVjLTEuMSAwLTIgLjktMiAydjE0YzAgMS4xLjkgMiAyIDJoMTRjMS4xIDAgMi0uOSAyLTJWNWMwLTEuMS0uOS0yLTItMnpNOCAxN2MtLjU1IDAtMS0uNDUtMS0xdi01YzAtLjU1LjQ1LTEgMS0xczEgLjQ1IDEgMXY1YzAgLjU1LS40NSAxLTEgMXptNCAwYy0uNTUgMC0xLS40NS0xLTFWOGMwLS41NS40NS0xIDEtMXMxIC40NSAxIDF2OGMwIC41NS0uNDUgMS0xIDF6bTQgMGMtLjU1IDAtMS0uNDUtMS0xdi0yYzAtLjU1LjQ1LTEgMS0xczEgLjQ1IDEgMXYyYzAgLjU1LS40NSAxLTEgMXoiLz48L3N2Zz4=" preserveAspectRatio="none"/><a target="_top" xlink:href="/docs/analysis/trace-processor"><rect x="943.75" y="168.75" width="312.5" height="581.25" fill="#ffe0b2" stroke="none" pointer-events="all"/><g transform="translate(-0.5 -0.5)"><switch><foreignObject style="overflow: visible; text-align: left;" pointer-events="none" width="100%" height="100%" requiredFeatures="http://www.w3.org/TR/SVG11/feature#Extensibility"><div xmlns="http://www.w3.org/1999/xhtml" style="display: flex; align-items: unsafe flex-start; justify-content: unsafe center; width: 311px; height: 1px; padding-top: 196px; margin-left: 945px;"><div style="box-sizing: border-box; font-size: 0; text-align: center; "><div style="display: inline-block; font-size: 32px; font-family: Roboto; color: #EA8600; line-height: 1.2; pointer-events: all; white-space: normal; word-wrap: normal; "><span style="font-size: 36px">Trace Processor<br /></span><span style="font-size: 20px">Android / Linux / MacOS / Win</span></div></div></div></foreignObject><text x="1100" y="228" fill="#EA8600" font-family="Roboto" font-size="32px" text-anchor="middle">Trace Processor...</text></switch></g></a><rect x="1300" y="75" width="350" height="700" fill="#e8f0fe" stroke="none" pointer-events="all"/><g transform="translate(-0.5 -0.5)"><switch><foreignObject style="overflow: visible; text-align: left;" pointer-events="none" width="100%" height="100%" requiredFeatures="http://www.w3.org/TR/SVG11/feature#Extensibility"><div xmlns="http://www.w3.org/1999/xhtml" style="display: flex; align-items: unsafe flex-start; justify-content: unsafe center; width: 348px; height: 1px; padding-top: 112px; margin-left: 1301px;"><div style="box-sizing: border-box; font-size: 0; text-align: center; "><div style="display: inline-block; font-size: 36px; font-family: Roboto; color: #4285F4; line-height: 1.2; pointer-events: all; white-space: normal; word-wrap: normal; "><font style="font-size: 36px ; font-style: normal ; font-weight: 400 ; letter-spacing: normal ; text-align: right ; text-indent: 0px ; text-transform: none ; word-spacing: 0px">Visualize </font><span style="font-size: 36px ; font-style: normal ; font-weight: 400 ; letter-spacing: normal ; text-align: right ; text-indent: 0px ; text-transform: none ; word-spacing: 0px ; float: none ; display: inline">traces</span></div></div></div></foreignObject><text x="1475" y="148" fill="#4285F4" font-family="Roboto" font-size="36px" text-anchor="middle">Visualize traces</text></switch></g><a xlink:href="https://ui.perfetto.dev" target="_blank"><rect x="1325" y="168.75" width="300" height="581.25" fill="#aecbfa" stroke="none" pointer-events="all"/><g transform="translate(-0.5 -0.5)"><switch><foreignObject style="overflow: visible; text-align: left;" pointer-events="none" width="100%" height="100%" requiredFeatures="http://www.w3.org/TR/SVG11/feature#Extensibility"><div xmlns="http://www.w3.org/1999/xhtml" style="display: flex; align-items: unsafe flex-start; justify-content: unsafe center; width: 298px; height: 1px; padding-top: 196px; margin-left: 1326px;"><div style="box-sizing: border-box; font-size: 0; text-align: center; "><div style="display: inline-block; font-size: 28px; font-family: Roboto; color: #1A73E8; line-height: 1.2; pointer-events: all; white-space: normal; word-wrap: normal; "><font style="font-size: 36px">Perfetto UI<br /></font><span style="font-size: 20px">HTML / JS</span></div></div></div></foreignObject><text x="1475" y="224" fill="#1A73E8" font-family="Roboto" font-size="28px" text-anchor="middle">Perfetto UI...</text></switch></g></a><ellipse cx="1475" cy="50" rx="50" ry="50" fill="#4285f4" stroke="none" pointer-events="all"/><image x="1442.5" y="17.5" width="64" height="64" xlink:href="data:image/svg+xml;base64,PHN2ZyB4bWxucz0iaHR0cDovL3d3dy53My5vcmcvMjAwMC9zdmciIHZpZXdCb3g9IjAgMCAyNCAyNCIgZmlsbD0id2hpdGUiIHdpZHRoPSIxOHB4IiBoZWlnaHQ9IjE4cHgiPjxwYXRoIGQ9Ik0yMCA0SDRjLTEuMSAwLTIgLjktMiAydjEyYzAgMS4xLjkgMiAyIDJoMTZjMS4xIDAgMi0uOSAyLTJWNmMwLTEuMS0uOS0yLTItMnpNNSAxMmgyYy41NSAwIDEgLjQ1IDEgMXMtLjQ1IDEtMSAxSDVjLS41NSAwLTEtLjQ1LTEtMXMuNDUtMSAxLTF6bTggNkg1Yy0uNTUgMC0xLS40NS0xLTFzLjQ1LTEgMS0xaDhjLjU1IDAgMSAuNDUgMSAxcy0uNDUgMS0xIDF6bTYgMGgtMmMtLjU1IDAtMS0uNDUtMS0xcy40NS0xIDEtMWgyYy41NSAwIDEgLjQ1IDEgMXMtLjQ1IDEtMSAxem0wLTRoLThjLS41NSAwLTEtLjQ1LTEtMXMuNDUtMSAxLTFoOGMuNTUgMCAxIC40NSAxIDFzLS40NSAxLTEgMXoiLz48L3N2Zz4=" preserveAspectRatio="none"/><rect x="965.63" y="325" width="268.75" height="100" fill="#ffcc80" stroke="none" pointer-events="all"/><g transform="translate(-0.5 -0.5)"><switch><foreignObject style="overflow: visible; text-align: left;" pointer-events="none" width="100%" height="100%" requiredFeatures="http://www.w3.org/TR/SVG11/feature#Extensibility"><div xmlns="http://www.w3.org/1999/xhtml" style="display: flex; align-items: unsafe center; justify-content: unsafe center; width: 267px; height: 1px; padding-top: 375px; margin-left: 967px;"><div style="box-sizing: border-box; font-size: 0; text-align: center; "><div style="display: inline-block; font-size: 28px; font-family: Roboto; color: #ac1900; line-height: 1.2; pointer-events: all; white-space: normal; word-wrap: normal; ">Trace importers<br /><span style="font-size: 20px">Protobuf, JSON, systrace</span></div></div></div></foreignObject><text x="1100" y="383" fill="#ac1900" font-family="Roboto" font-size="28px" text-anchor="middle">Trace importers...</text></switch></g><a target="_top" xlink:href="/docs/analysis/metrics"><rect x="965.63" y="625" width="268.75" height="100" fill="#ffcc80" stroke="none" pointer-events="all"/><g transform="translate(-0.5 -0.5)"><switch><foreignObject style="overflow: visible; text-align: left;" pointer-events="none" width="100%" height="100%" requiredFeatures="http://www.w3.org/TR/SVG11/feature#Extensibility"><div xmlns="http://www.w3.org/1999/xhtml" style="display: flex; align-items: unsafe center; justify-content: unsafe center; width: 267px; height: 1px; padding-top: 675px; margin-left: 967px;"><div style="box-sizing: border-box; font-size: 0; text-align: center; "><div style="display: inline-block; font-size: 28px; font-family: Roboto; color: #ac1900; line-height: 1.2; pointer-events: all; white-space: normal; word-wrap: normal; "><font style="font-size: 28px">Trace-based metrics<br /></font><font style="font-size: 20px">JSON / Protobuf / CSV</font></div></div></div></foreignObject><text x="1100" y="683" fill="#ac1900" font-family="Roboto" font-size="28px" text-anchor="middle">Trace-based metrics...</text></switch></g></a><a target="_top" xlink:href="/docs/analysis/sql-tables"><rect x="965.63" y="475" width="268.75" height="100" fill="#ffcc80" stroke="none" pointer-events="all"/><g transform="translate(-0.5 -0.5)"><switch><foreignObject style="overflow: visible; text-align: left;" pointer-events="none" width="100%" height="100%" requiredFeatures="http://www.w3.org/TR/SVG11/feature#Extensibility"><div xmlns="http://www.w3.org/1999/xhtml" style="display: flex; align-items: unsafe center; justify-content: unsafe center; width: 267px; height: 1px; padding-top: 525px; margin-left: 967px;"><div style="box-sizing: border-box; font-size: 0; text-align: center; "><div style="display: inline-block; font-size: 28px; font-family: Roboto; color: #ac1900; line-height: 1.2; pointer-events: all; white-space: normal; word-wrap: normal; ">SQL query engine<br /><font style="font-size: 20px">Based on SQLite</font></div></div></div></foreignObject><text x="1100" y="533" fill="#ac1900" font-family="Roboto" font-size="28px" text-anchor="middle">SQL query engine...</text></switch></g></a><rect x="325" y="550" width="250" height="75" fill="#aed581" stroke="none" pointer-events="all"/><g transform="translate(-0.5 -0.5)"><switch><foreignObject style="overflow: visible; text-align: left;" pointer-events="none" width="100%" height="100%" requiredFeatures="http://www.w3.org/TR/SVG11/feature#Extensibility"><div xmlns="http://www.w3.org/1999/xhtml" style="display: flex; align-items: unsafe center; justify-content: unsafe center; width: 248px; height: 1px; padding-top: 588px; margin-left: 326px;"><div style="box-sizing: border-box; font-size: 0; text-align: center; "><div style="display: inline-block; font-size: 24px; font-family: Roboto; color: #1b5e20; line-height: 1.2; pointer-events: all; white-space: normal; word-wrap: normal; "><font style="font-size: 24px">Tracing service<br /><span style="font-size: 16px">Mojo</span><br /></font></div></div></div></foreignObject><text x="450" y="595" fill="#1b5e20" font-family="Roboto" font-size="24px" text-anchor="middle">Tracing service...</text></switch></g><rect x="325" y="225" width="250" height="200" fill="#dcedc8" stroke="none" pointer-events="all"/><g transform="translate(-0.5 -0.5)"><switch><foreignObject style="overflow: visible; text-align: left;" pointer-events="none" width="100%" height="100%" requiredFeatures="http://www.w3.org/TR/SVG11/feature#Extensibility"><div xmlns="http://www.w3.org/1999/xhtml" style="display: flex; align-items: unsafe center; justify-content: unsafe center; width: 248px; height: 1px; padding-top: 325px; margin-left: 326px;"><div style="box-sizing: border-box; font-size: 0; text-align: center; "><div style="display: inline-block; font-size: 24px; font-family: Roboto; color: #1b5e20; line-height: 1.2; pointer-events: all; white-space: normal; word-wrap: normal; "><font style="font-size: 24px">Chrome-specific<br />data-sources</font></div></div></div></foreignObject><text x="450" y="332" fill="#1b5e20" font-family="Roboto" font-size="24px" text-anchor="middle">Chrome-specific...</text></switch></g><a target="_top" xlink:href="/docs/instrumentation/tracing-sdk#in-process-mode"><rect x="625" y="550" width="250" height="75" fill="#aed581" stroke="none" pointer-events="all"/><g transform="translate(-0.5 -0.5)"><switch><foreignObject style="overflow: visible; text-align: left;" pointer-events="none" width="100%" height="100%" requiredFeatures="http://www.w3.org/TR/SVG11/feature#Extensibility"><div xmlns="http://www.w3.org/1999/xhtml" style="display: flex; align-items: unsafe center; justify-content: unsafe center; width: 248px; height: 1px; padding-top: 588px; margin-left: 626px;"><div style="box-sizing: border-box; font-size: 0; text-align: center; "><div style="display: inline-block; font-size: 24px; font-family: Roboto; color: #1b5e20; line-height: 1.2; pointer-events: all; white-space: normal; word-wrap: normal; "><font style="font-size: 24px">In-process<br />service thread</font></div></div></div></foreignObject><text x="750" y="595" fill="#1b5e20" font-family="Roboto" font-size="24px" text-anchor="middle">In-process...</text></switch></g></a><a target="_top" xlink:href="/docs/concepts/service-model"><rect x="25" y="550" width="250" height="75" fill="#aed581" stroke="none" pointer-events="all"/><g transform="translate(-0.5 -0.5)"><switch><foreignObject style="overflow: visible; text-align: left;" pointer-events="none" width="100%" height="100%" requiredFeatures="http://www.w3.org/TR/SVG11/feature#Extensibility"><div xmlns="http://www.w3.org/1999/xhtml" style="display: flex; align-items: unsafe center; justify-content: unsafe center; width: 248px; height: 1px; padding-top: 588px; margin-left: 26px;"><div style="box-sizing: border-box; font-size: 0; text-align: center; "><div style="display: inline-block; font-size: 24px; font-family: Roboto; color: #1b5e20; line-height: 1.2; pointer-events: all; white-space: normal; word-wrap: normal; ">Tracing daemon<br /><font style="font-size: 16px">UNIX socket</font></div></div></div></foreignObject><text x="150" y="595" fill="#1b5e20" font-family="Roboto" font-size="24px" text-anchor="middle">Tracing daemon...</text></switch></g></a><path d="M 300 150 L 296.7 626.4" fill="none" stroke="#8bc34a" stroke-miterlimit="10" stroke-dasharray="3 3" pointer-events="stroke"/><path d="M 600 149.3 L 596.7 625.7" fill="none" stroke="#8bc34a" stroke-miterlimit="10" stroke-dasharray="3 3" pointer-events="stroke"/><a target="_top" xlink:href="/docs/instrumentation/track-events"><rect x="325" y="450" width="550" height="75" fill="#dcedc8" stroke="none" pointer-events="all"/><g transform="translate(-0.5 -0.5)"><switch><foreignObject style="overflow: visible; text-align: left;" pointer-events="none" width="100%" height="100%" requiredFeatures="http://www.w3.org/TR/SVG11/feature#Extensibility"><div xmlns="http://www.w3.org/1999/xhtml" style="display: flex; align-items: unsafe center; justify-content: unsafe center; width: 548px; height: 1px; padding-top: 488px; margin-left: 326px;"><div style="box-sizing: border-box; font-size: 0; text-align: center; "><div style="display: inline-block; font-size: 24px; font-family: Roboto; color: #1b5e20; line-height: 1.2; pointer-events: all; white-space: normal; word-wrap: normal; "><font>Track event library<br /><font style="font-size: 20px">TRACE_EVENT(...)</font><br /></font></div></div></div></foreignObject><text x="600" y="495" fill="#1b5e20" font-family="Roboto" font-size="24px" text-anchor="middle">Track event library...</text></switch></g></a><rect x="625" y="225" width="250" height="200" fill="#dcedc8" stroke="none" pointer-events="all"/><g transform="translate(-0.5 -0.5)"><switch><foreignObject style="overflow: visible; text-align: left;" pointer-events="none" width="100%" height="100%" requiredFeatures="http://www.w3.org/TR/SVG11/feature#Extensibility"><div xmlns="http://www.w3.org/1999/xhtml" style="display: flex; align-items: unsafe center; justify-content: unsafe center; width: 248px; height: 1px; padding-top: 325px; margin-left: 626px;"><div style="box-sizing: border-box; font-size: 0; text-align: center; "><div style="display: inline-block; font-size: 24px; font-family: Roboto; color: #1b5e20; line-height: 1.2; pointer-events: all; white-space: normal; word-wrap: normal; "><font style="font-size: 24px">App-specific<br />data-sources</font></div></div></div></foreignObject><text x="750" y="332" fill="#1b5e20" font-family="Roboto" font-size="24px" text-anchor="middle">App-specific...</text></switch></g><rect x="1350" y="325" width="250" height="103.12" fill="#669df6" stroke="none" pointer-events="all"/><g transform="translate(-0.5 -0.5)"><switch><foreignObject style="overflow: visible; text-align: left;" pointer-events="none" width="100%" height="100%" requiredFeatures="http://www.w3.org/TR/SVG11/feature#Extensibility"><div xmlns="http://www.w3.org/1999/xhtml" style="display: flex; align-items: unsafe center; justify-content: unsafe center; width: 248px; height: 1px; padding-top: 377px; margin-left: 1351px;"><div style="box-sizing: border-box; font-size: 0; text-align: center; "><div style="display: inline-block; font-size: 28px; font-family: Roboto; color: #ffffff; line-height: 1.2; pointer-events: all; white-space: normal; word-wrap: normal; ">Trace Processor<br /><font style="font-size: 20px">Web Assembly</font></div></div></div></foreignObject><text x="1475" y="385" fill="#ffffff" font-family="Roboto" font-size="28px" text-anchor="middle">Trace Processor...</text></switch></g><rect x="1350" y="475" width="250" height="103.12" fill="#669df6" stroke="none" pointer-events="all"/><g transform="translate(-0.5 -0.5)"><switch><foreignObject style="overflow: visible; text-align: left;" pointer-events="none" width="100%" height="100%" requiredFeatures="http://www.w3.org/TR/SVG11/feature#Extensibility"><div xmlns="http://www.w3.org/1999/xhtml" style="display: flex; align-items: unsafe center; justify-content: unsafe center; width: 248px; height: 1px; padding-top: 527px; margin-left: 1351px;"><div style="box-sizing: border-box; font-size: 0; text-align: center; "><div style="display: inline-block; font-size: 28px; font-family: Roboto; color: #ffffff; line-height: 1.2; pointer-events: all; white-space: normal; word-wrap: normal; "><font>ADB over WebUSB<br /></font><font style="font-size: 20px">For Android</font></div></div></div></foreignObject><text x="1475" y="535" fill="#ffffff" font-family="Roboto" font-size="28px" text-anchor="middle">ADB over WebUSB...</text></switch></g></g><switch><g requiredFeatures="http://www.w3.org/TR/SVG11/feature#Extensibility"/><a transform="translate(0,-5)" xlink:href="https://desk.draw.io/support/solutions/articles/16000042487" target="_blank"><text text-anchor="middle" font-size="10px" x="50%" y="100%">Viewer does not support full SVG 1.1</text></a></switch></svg>
\ No newline at end of file
diff --git a/docs/images/perfetto-ui-screenshot.png b/docs/images/perfetto-ui-screenshot.png
new file mode 100644
index 0000000..090d1e0
--- /dev/null
+++ b/docs/images/perfetto-ui-screenshot.png
Binary files differ
diff --git a/docs/images/power-rails.png b/docs/images/power-rails.png
new file mode 100644
index 0000000..608f7b2
--- /dev/null
+++ b/docs/images/power-rails.png
Binary files differ
diff --git a/docs/images/proc_stat.png b/docs/images/proc_stat.png
new file mode 100644
index 0000000..1721769
--- /dev/null
+++ b/docs/images/proc_stat.png
Binary files differ
diff --git a/docs/images/profile-diamond.png b/docs/images/profile-diamond.png
new file mode 100644
index 0000000..5f14756
--- /dev/null
+++ b/docs/images/profile-diamond.png
Binary files differ
diff --git a/docs/images/protozero-ssw.png b/docs/images/protozero-ssw.png
new file mode 100644
index 0000000..20ffb82
--- /dev/null
+++ b/docs/images/protozero-ssw.png
Binary files differ
diff --git a/docs/images/record-trace.png b/docs/images/record-trace.png
new file mode 100644
index 0000000..ad3a54e
--- /dev/null
+++ b/docs/images/record-trace.png
Binary files differ
diff --git a/docs/images/rss_stat_and_mm_event.png b/docs/images/rss_stat_and_mm_event.png
new file mode 100644
index 0000000..fdab64f
--- /dev/null
+++ b/docs/images/rss_stat_and_mm_event.png
Binary files differ
diff --git a/docs/images/sched-slices.png b/docs/images/sched-slices.png
new file mode 100644
index 0000000..1bae830
--- /dev/null
+++ b/docs/images/sched-slices.png
Binary files differ
diff --git a/docs/images/shmem-abi-concepts.png b/docs/images/shmem-abi-concepts.png
new file mode 100644
index 0000000..df2534f
--- /dev/null
+++ b/docs/images/shmem-abi-concepts.png
Binary files differ
diff --git a/docs/images/shmem-abi-overview.png b/docs/images/shmem-abi-overview.png
new file mode 100644
index 0000000..1544cdf
--- /dev/null
+++ b/docs/images/shmem-abi-overview.png
Binary files differ
diff --git a/docs/images/shmem-abi-page.png b/docs/images/shmem-abi-page.png
new file mode 100644
index 0000000..ef8fa26
--- /dev/null
+++ b/docs/images/shmem-abi-page.png
Binary files differ
diff --git a/docs/images/shmem-abi-spans.png b/docs/images/shmem-abi-spans.png
new file mode 100644
index 0000000..be81fa3
--- /dev/null
+++ b/docs/images/shmem-abi-spans.png
Binary files differ
diff --git a/docs/images/slices.png b/docs/images/slices.png
new file mode 100644
index 0000000..7ca1e9e
--- /dev/null
+++ b/docs/images/slices.png
Binary files differ
diff --git a/docs/images/socket-protocol.png b/docs/images/socket-protocol.png
new file mode 100644
index 0000000..c3bf91f
--- /dev/null
+++ b/docs/images/socket-protocol.png
Binary files differ
diff --git a/docs/images/sys_stat_counters.png b/docs/images/sys_stat_counters.png
new file mode 100644
index 0000000..ab3c8df
--- /dev/null
+++ b/docs/images/sys_stat_counters.png
Binary files differ
diff --git a/docs/images/syscalls.png b/docs/images/syscalls.png
new file mode 100644
index 0000000..052d11e
--- /dev/null
+++ b/docs/images/syscalls.png
Binary files differ
diff --git a/docs/images/syssrv-apk-assets-focus.png b/docs/images/syssrv-apk-assets-focus.png
new file mode 100644
index 0000000..c5070dd
--- /dev/null
+++ b/docs/images/syssrv-apk-assets-focus.png
Binary files differ
diff --git a/docs/images/syssrv-apk-assets-two.png b/docs/images/syssrv-apk-assets-two.png
new file mode 100644
index 0000000..dea36ef
--- /dev/null
+++ b/docs/images/syssrv-apk-assets-two.png
Binary files differ
diff --git a/docs/images/thread-states.png b/docs/images/thread-states.png
new file mode 100644
index 0000000..2644667
--- /dev/null
+++ b/docs/images/thread-states.png
Binary files differ
diff --git a/docs/images/tp-table-inheritance.png b/docs/images/tp-table-inheritance.png
new file mode 100644
index 0000000..5039256
--- /dev/null
+++ b/docs/images/tp-table-inheritance.png
Binary files differ
diff --git a/docs/images/trace-processor.png b/docs/images/trace-processor.png
new file mode 100644
index 0000000..217fc77
--- /dev/null
+++ b/docs/images/trace-processor.png
Binary files differ
diff --git a/docs/images/trace-rss-camera.png b/docs/images/trace-rss-camera.png
new file mode 100644
index 0000000..7619898
--- /dev/null
+++ b/docs/images/trace-rss-camera.png
Binary files differ
diff --git a/docs/images/trace-view.png b/docs/images/trace-view.png
new file mode 100644
index 0000000..f1c3bc9
--- /dev/null
+++ b/docs/images/trace-view.png
Binary files differ
diff --git a/docs/images/trace_config.png b/docs/images/trace_config.png
new file mode 100644
index 0000000..cb129b0
--- /dev/null
+++ b/docs/images/trace_config.png
Binary files differ
diff --git a/docs/images/trace_config_buffer_mapping.png b/docs/images/trace_config_buffer_mapping.png
new file mode 100644
index 0000000..3753585
--- /dev/null
+++ b/docs/images/trace_config_buffer_mapping.png
Binary files differ
diff --git a/docs/images/traceconv-summary.png b/docs/images/traceconv-summary.png
new file mode 100644
index 0000000..01244f9
--- /dev/null
+++ b/docs/images/traceconv-summary.png
Binary files differ
diff --git a/docs/images/tracing-protocol.png b/docs/images/tracing-protocol.png
new file mode 100644
index 0000000..a0c2994
--- /dev/null
+++ b/docs/images/tracing-protocol.png
Binary files differ
diff --git a/docs/track-events.png b/docs/images/track-events.png
similarity index 100%
rename from docs/track-events.png
rename to docs/images/track-events.png
Binary files differ
diff --git a/docs/track-timeline.png b/docs/images/track-timeline.png
similarity index 100%
rename from docs/track-timeline.png
rename to docs/images/track-timeline.png
Binary files differ
diff --git a/docs/images/tracks.png b/docs/images/tracks.png
new file mode 100644
index 0000000..ae427a5
--- /dev/null
+++ b/docs/images/tracks.png
Binary files differ
diff --git a/docs/images/userspace.png b/docs/images/userspace.png
new file mode 100644
index 0000000..d0014f8
--- /dev/null
+++ b/docs/images/userspace.png
Binary files differ
diff --git a/docs/instrumentation/tracing-sdk.md b/docs/instrumentation/tracing-sdk.md
new file mode 100644
index 0000000..2efac8d
--- /dev/null
+++ b/docs/instrumentation/tracing-sdk.md
@@ -0,0 +1,394 @@
+# Tracing SDK
+
+The Perfetto Tracing SDK is a C++11 library that allows userspace applications
+to emit trace events and add more app-specific context to a Perfetto trace.
+
+When using the Tracing SDK there are two main aspects to consider:
+
+1. Whether you are interested only in tracing events coming from your own app
+ or want to collect full-stack traces that overlay app trace events with
+ system trace events like scheduler traces, syscalls or any other Perfetto
+ data source.
+
+2. For app-specific tracing, whether you need to trace simple types of timeline
+ events (e.g., slices, counters) or need to define complex data sources with a
+ custom strongly-typed schema (e.g., for dumping the state of a subsystem of
+ your app into the trace).
+
+For Android-only instrumentation, the advice is to keep using the existing
+[android.os.Trace (SDK)][atrace-sdk] / [ATrace_* (NDK)][atrace-ndk] if they
+are sufficient for your use cases. Atrace-based instrumentation is fully
+supported in Perfetto.
+See the [Data Sources -> Android System -> Atrace Instrumentation][atrace-ds]
+for details.
+
+## Getting started
+
+TIP: The code from these examples is also available as a
+[GitHub repository](https://github.com/skyostil/perfetto-sdk-example).
+
+To start using the Client API, first check out the latest SDK release:
+
+```sh
+git clone https://android.googlesource.com/platform/external/perfetto -b v3.1
+```
+
+The SDK consists of two files, `sdk/perfetto.h` and `sdk/perfetto.cc`. These are
+an amalgamation of the Client API designed to easy to integrate to existing
+build systems. The sources are self-contained and require only a C++11 compliant
+standard library.
+
+For example, to add the SDK to a CMake project, edit your CMakeLists.txt:
+
+```cmake
+cmake_minimum_required(VERSION 3.13)
+project(PerfettoExample)
+find_package(Threads)
+
+# Define a static library for Perfetto.
+include_directories(perfetto/sdk)
+add_library(perfetto STATIC perfetto/sdk/perfetto.cc)
+
+# Link the library to your main executable.
+add_executable(example example.cc)
+target_link_libraries(example perfetto ${CMAKE_THREAD_LIBS_INIT})
+```
+
+Next, initialize Perfetto in your program:
+
+```C++
+#include <perfetto.h>
+
+int main(int argv, char** argc) {
+ perfetto::TracingInitArgs args;
+
+ // The backends determine where trace events are recorded. You may select one
+ // or more of:
+
+ // 1) The in-process backend only records within the app itself.
+ args.backends |= perfetto::kInProcessBackend;
+
+ // 2) The system backend writes events into a system Perfetto daemon,
+ // allowing merging app and system events (e.g., ftrace) on the same
+ // timeline. Requires the Perfetto `traced` daemon to be running (e.g.,
+ // on Android Pie and newer).
+ args.backends |= perfetto::kSystemBackend;
+
+ perfetto::Tracing::Initialize(args);
+}
+```
+
+You are now ready to instrument your app with trace events.
+
+## Custom data sources vs Track events
+
+The SDK offers two abstraction layers to inject tracing data, built on top of
+each other, which trade off code complexity vs expressive power:
+[track events](#track-events) and [custom data sources](#custom-data-sources).
+
+### Track events
+
+Track events are the suggested option when dealing with app-specific tracing as
+they take care of a number of subtleties (e.g., thread safety, flushing, string
+interning).
+Track events are time bounded events (e.g., slices, counter) based on simple
+annotation tags in the codebase, like this:
+
+```c++
+#include <perfetto.h>
+
+PERFETTO_DEFINE_CATEGORIES(
+ perfetto::Category("rendering")
+ .SetDescription("Events from the graphics subsystem"),
+ perfetto::Category("network")
+ .SetDescription("Network upload and download statistics"));
+
+...
+
+int main(int argv, char** argc) {
+ ...
+ perfetto::Tracing::Initialize(args);
+ perfetto::TrackEvent::Register();
+}
+
+...
+
+void LayerTreeHost::DoUpdateLayers() {
+ TRACE_EVENT("rendering", "LayerTreeHost::DoUpdateLayers");
+ ...
+ for (PictureLayer& pl : layers) {
+ TRACE_EVENT("rendering", "PictureLayer::Update");
+ pl.Update();
+ }
+}
+```
+
+Which are rendered in the UI as follows:
+
+
+
+Track events are the best default option and serve most tracing use cases with
+very little complexity.
+
+To include your new track events in the trace, ensure that the `track_event`
+data source is included in the trace config. If you do not specify any
+categories then all non-debug categories will be included by default. However,
+you can also add just the categories you are interested in like so:
+
+```protobuf
+data_sources {
+ config {
+ name: "track_event"
+ track_event_config {
+ enabled_categories: "rendering"
+ }
+ }
+}
+```
+
+See the [Track events page](track-events.md) for full instructions.
+
+### Custom data sources
+
+For most uses, track events are the most straightforward way of instrumenting
+apps for tracing. However, in some rare circumstances they are not
+flexible enough, e.g., when the data doesn't fit the notion of a track or is
+high volume enough that it needs a strongly typed schema to minimize the size of
+each event. In this case, you can implement a *custom data source* for
+Perfetto.
+
+Unlike track events, when working with custom data sources, you will also need
+corresponding changes in [trace processor](/docs/analysis/trace-processor.md)
+to enable importing your data format.
+
+A custom data source is a subclass of `perfetto::DataSource`. Perfetto with
+automatically create one instance of the class for each tracing session it is
+active in (usually just one).
+
+```C++
+class CustomDataSource : public perfetto::DataSource<CustomDataSource> {
+ public:
+ void OnSetup(const SetupArgs&) override {
+ // Use this callback to apply any custom configuration to your data source
+ // based on the TraceConfig in SetupArgs.
+ }
+
+ void OnStart(const StartArgs&) override {
+ // This notification can be used to initialize the GPU driver, enable
+ // counters, etc. StartArgs will contains the DataSourceDescriptor,
+ // which can be extended.
+ }
+
+ void OnStop(const StopArgs&) override {
+ // Undo any initialization done in OnStart.
+ }
+
+ // Data sources can also have per-instance state.
+ int my_custom_state = 0;
+};
+
+PERFETTO_DECLARE_DATA_SOURCE_STATIC_MEMBERS(CustomDataSource);
+```
+
+The data source's static data should be defined in one source file like this:
+
+```C++
+PERFETTO_DEFINE_DATA_SOURCE_STATIC_MEMBERS(CustomDataSource);
+```
+
+Custom data sources need to be registered with Perfetto:
+
+```C++
+int main(int argv, char** argc) {
+ ...
+ perfetto::Tracing::Initialize(args);
+ // Add the following:
+ perfetto::DataSourceDescriptor dsd;
+ dsd.set_name("com.example.custom_data_source");
+ CustomDataSource::Register(dsd);
+}
+```
+
+As with all data sources, the custom data source needs to be specified in the
+trace config to enable tracing:
+
+```C++
+perfetto::TraceConfig cfg;
+auto* ds_cfg = cfg.add_data_sources()->mutable_config();
+ds_cfg->set_name("com.example.custom_data_source");
+```
+
+Finally, call the `Trace()` method to record an event with your custom data
+source. The lambda function passed to that method will only be called if tracing
+is enabled. It is always called synchronously and possibly multiple times if
+multiple concurrent tracing sessions are active.
+
+```C++
+CustomDataSource::Trace([](CustomDataSource::TraceContext ctx) {
+ auto packet = ctx.NewTracePacket();
+ packet->set_timestamp(perfetto::TrackEvent::GetTraceTimeNs());
+ packet->set_for_testing()->set_str("Hello world!");
+});
+```
+
+If necessary the `Trace()` method can access the custom data source state
+(`my_custom_state` in the example above). Doing so, will take a mutex to
+ensure data source isn't destroyed (e.g., because of stopping tracing) while
+the `Trace()` method is called on another thread. For example:
+
+```C++
+CustomDataSource::Trace([](CustomDataSource::TraceContext ctx) {
+ auto safe_handle = trace_args.GetDataSourceLocked(); // Holds a RAII lock.
+ DoSomethingWith(safe_handle->my_custom_state);
+});
+```
+
+## In-process vs System mode
+
+The two modes are not mutually exclusive. An app can be configured to work
+in both modes and respond both to in-process tracing requests and system
+tracing requests. Both modes generate the same trace file format.
+
+### In-process mode
+
+In this mode both the perfetto service and the app-defined data sources are
+hosted fully in-process, in the same process of the profiled app. No connection
+to the system `traced` daemon will be attempted.
+
+In-process mode can be enabled by setting
+`TracingInitArgs.backends = perfetto::kInProcessBackend` when initializing the
+SDK, see examples below.
+
+This mode is used to generate traces that contain only events emitted by
+the app, but not other types of events (e.g. scheduler traces).
+
+The main advantage is that by running fully in-process, it doesn't require any
+special OS privileges and the profiled process can control the lifecycle of
+tracing sessions.
+
+This mode is supported on Android, Linux, MacOS and Windows.
+
+### System mode
+
+In this mode the app-defined data sources will connect to the external `traced`
+service using the [IPC over UNIX socket][ipc].
+
+System mode can be enabled by setting
+`TracingInitArgs.backends = perfetto::kSystemBackend` when initializing the SDK,
+see examples below.
+
+The main advantage of this mode is that it is possible to create fused traces where
+app events are overlaid on the same timeline of OS events. This enables
+full-stack performance investigations, looking all the way through syscalls and
+kernel scheduling events.
+
+The main limitation of this mode is that it requires the external `traced` daemon
+to be up and running and reachable through the UNIX socket connection.
+
+This is suggested for local debugging or lab testing scenarios where the user
+(or the test harness) can control the OS deployment (e.g., sideload binaries on
+Android).
+
+When using system mode, the tracing session must be controlled from the outside,
+using the `perfetto` command-line client
+(See [reference](/docs/reference/perfetto-cli)). This is because when collecting
+system traces, tracing data producers are not allowed to read back the trace
+data as it might disclose information about other processes and allow
+side-channel attacks.
+
+* On Android 9 (Pie) and beyond, traced is shipped as part of the platform.
+* On older versions of Android, traced can be built from sources using the
+ the [standalone NDK-based workflow](/docs/contributing/build-instructions.md)
+ and sideloaded via adb shell.
+* On Linux and MacOS `traced` must be built and run separately. See the
+ [Linux quickstart](/docs/quickstart/linux-tracing.md) for instructions.
+
+_System mode is not yet supported on Windows, due to the lack of an IPC
+implementation_.
+
+## {#recording} Recording traces through the API
+
+_Tracing through the API is currently only supported with the in-process mode.
+When using system mode, use the `perfetto` cmdline client (see quickstart
+guides)._
+
+First initialize a [TraceConfig](/docs/reference/trace-config-proto.autogen)
+message which specifies what type of data to record.
+
+If your app includes [track events](track-events.md) (i.e, `TRACE_EVENT`), you
+typically want to choose the categories which are enabled for tracing.
+
+By default, all non-debug categories are enabled, but you can enable a specific
+one like this:
+
+```C++
+perfetto::protos::gen::TrackEventConfig track_event_cfg;
+track_event_cfg.add_disabled_categories("*");
+track_event_cfg.add_enabled_categories("rendering");
+```
+
+Next, build the main trace config together with the track event part:
+
+```C++
+perfetto::TraceConfig cfg;
+cfg.add_buffers()->set_size_kb(1024); // Record up to 1 MiB.
+auto* ds_cfg = cfg.add_data_sources()->mutable_config();
+ds_cfg->set_name("track_event");
+ds_cfg->set_track_event_config_raw(track_event_cfg.SerializeAsString());
+```
+
+If your app includes a custom data source, you can also enable it here:
+
+```C++
+ds_cfg = cfg.add_data_sources()->mutable_config();
+ds_cfg->set_name("my_data_source");
+```
+
+After building the trace config, you can begin tracing:
+
+```C++
+std::unique_ptr<perfetto::TracingSession> tracing_session(
+ perfetto::Tracing::NewTrace());
+tracing_session->Setup(cfg);
+tracing_session->StartBlocking();
+```
+
+TIP: API methods with `Blocking` in their name will suspend the calling thread
+ until the respective operation is complete. There are also asynchronous
+ variants that don't have this limitation.
+
+Now that tracing is active, instruct your app to perform the operation you
+want to record. After that, stop tracing and collect the
+protobuf-formatted trace data:
+
+```C++
+tracing_session->StopBlocking();
+std::vector<char> trace_data(tracing_session->ReadTraceBlocking());
+
+// Write the trace into a file.
+std::ofstream output;
+output.open("example.pftrace", std::ios::out | std::ios::binary);
+output.write(&trace_data[0], trace_data.size());
+output.close();
+```
+
+To save memory with longer traces, you can also tell Perfetto to write
+directly into a file by passing a file descriptor into Setup(), remembering
+to close the file after tracing is done:
+
+```C++
+int fd = open("example.pftrace", O_RDWR | O_CREAT | O_TRUNC, 0600);
+tracing_session->Setup(cfg, fd);
+tracing_session->StartBlocking();
+// ...
+tracing_session->StopBlocking();
+close(fd);
+```
+
+The resulting trace file can be directly opened in the [Perfetto
+UI](https://ui.perfetto.dev) or the [Trace Processor](/docs/analysis/trace-processor.md).
+
+[ipc]: /docs/design-docs/api-and-abi.md#socket-protocol
+[atrace-ds]: /docs/data-sources/atrace.md
+[atrace-ndk]: https://developer.android.com/ndk/reference/group/tracing
+[atrace-sdk]: https://developer.android.com/reference/android/os/Trace
\ No newline at end of file
diff --git a/docs/instrumentation/track-events.md b/docs/instrumentation/track-events.md
new file mode 100644
index 0000000..4ad67ae
--- /dev/null
+++ b/docs/instrumentation/track-events.md
@@ -0,0 +1,413 @@
+# Track events (Tracing SDK)
+
+Track events are part of the [Perfetto Tracing SDK](tracing-sdk.md).
+
+*Track events* are application specific, time bounded events recorded into a
+*trace* while the application is running. Track events are always associated
+with a *track*, which is a timeline of monotonically increasing time. A track
+corresponds to an independent sequence of execution, such as a single thread
+in a process.
+
+
+
+See the [Getting started](/docs/instrumentation/tracing-sdk#getting-started)
+section of the Tracing SDK page for instructions on how to check out and
+build the SDK.
+
+TIP: The code from this example is also available as a
+ [GitHub repository](https://github.com/skyostil/perfetto-sdk-example).
+
+There are a few main types of track events:
+
+- **Slices**, which represent nested, time bounded operations. For example,
+ a slice could cover the time period from when a function begins executing
+ to when it returns, the time spent loading a file from the network or the
+ time to complete a user journey.
+
+- **Counters**, which are snapshots of time-varying numeric values. For
+ example, a track event can record instantaneous the memory usage of a
+ process during its execution.
+
+- **Flows**, which are used to connect related slices that span different
+ tracks together. For example, if an image file is first loaded from
+ the network and then decoded on a thread pool, a flow event can be used to
+ highlight its path through the system. (Not fully implemented yet).
+
+The [Perfetto UI](https://ui.perfetto.dev) has built in support for track
+events, which provides a useful way to quickly visualize the internal
+processing of an app. For example, the [Chrome
+browser](https://www.chromium.org/developers/how-tos/trace-event-profiling-tool)
+is deeply instrumented with track events to assist in debugging, development
+and performance analysis.
+
+To start using track events, first define the set of categories that your events
+will fall into. Each category can be separately enabled or disabled for tracing
+(see [Category configuration](#category-configuration)).
+
+Add the list of categories into a header file (e.g.,
+`my_app_tracing_categories.h`) like this:
+
+```C++
+#include <perfetto.h>
+
+PERFETTO_DEFINE_CATEGORIES(
+ perfetto::Category("rendering")
+ .SetDescription("Events from the graphics subsystem"),
+ perfetto::Category("network")
+ .SetDescription("Network upload and download statistics"));
+```
+
+Then, declare static storage for the categories in a cc file (e.g.,
+`my_app_tracing_categories.cc`):
+
+```C++
+#include "my_app_tracing_categories.h"
+
+PERFETTO_TRACK_EVENT_STATIC_STORAGE();
+```
+
+Finally, initialize track events after the client library is brought up:
+
+```C++
+int main(int argv, char** argc) {
+ ...
+ perfetto::Tracing::Initialize(args);
+ perfetto::TrackEvent::Register(); // Add this.
+}
+```
+
+Now you can add track events to existing functions like this:
+
+```C++
+#include "my_app_tracing_categories.h"
+
+void DrawPlayer() {
+ TRACE_EVENT("rendering", "DrawPlayer");
+ ...
+}
+```
+
+This type of trace event is scoped, under the hood it uses C++ [RAII]. The
+event will cover the time from when the `TRACE_EVENT` annotation is encountered
+to the end of the block (in the example above, until the function returns).
+
+You can also supply (up to two) debug annotations together with the event.
+
+```C++
+int player_number = 1;
+TRACE_EVENT("rendering", "DrawPlayer", "player_number", player_number);
+```
+
+For more complex arguments, you can define [your own protobuf
+messages](/protos/perfetto/trace/track_event/track_event.proto) and emit
+them as a parameter for the event.
+
+NOTE: Currently custom protobuf messages need to be added directly to the
+ Perfetto repository under `protos/perfetto/trace`, and Perfetto itself
+ must also be rebuilt. We are working
+ [to lift this limitation](https://github.com/google/perfetto/issues/11).
+
+As an example of a custom track event argument type, save the following as
+`protos/perfetto/trace/track_event/player_info.proto`:
+
+```protobuf
+message PlayerInfo {
+ optional string name = 1;
+ optional uint64 score = 2;
+}
+```
+
+This new file should also be added to
+`protos/perfetto/trace/track_event/BUILD.gn`:
+
+```json
+sources = [
+ ...
+ "player_info.proto"
+]
+```
+
+Also, a matching argument should be added to the track event message
+definition in
+`protos/perfetto/trace/track_event/track_event.proto`:
+
+```protobuf
+import "protos/perfetto/trace/track_event/player_info.proto";
+
+...
+
+message TrackEvent {
+ ...
+ // New argument types go here.
+ optional PlayerInfo player_info = 1000;
+}
+```
+
+The corresponding trace point could look like this:
+
+```C++
+Player my_player;
+TRACE_EVENT("category", "MyEvent", [&](perfetto::EventContext ctx) {
+ auto player = ctx.event()->set_player_info();
+ player->set_name(my_player.name());
+ player->set_player_score(my_player.score());
+});
+```
+
+The lambda function passed to the macro is only called if tracing is enabled for
+the given category. It is always called synchronously and possibly multiple
+times if multiple concurrent tracing sessions are active.
+
+Now that you have instrumented your app with track events, you are ready to
+start [recording traces](tracing-sdk.md#recording).
+
+## Category configuration
+
+All track events are assigned to one more trace categories. For example:
+
+```C++
+TRACE_EVENT("rendering", ...); // Event in the "rendering" category.
+```
+
+By default, all non-debug and non-slow track event categories are enabled for
+tracing. *Debug* and *slow* categories are categories with special tags:
+
+ - `"debug"` categories can give more verbose debugging output for a particular
+ subsystem.
+ - `"slow"` categories record enough data that they can affect the interactive
+ performance of your app.
+
+Category tags can be can be defined like this:
+
+```C++
+perfetto::Category("rendering.debug")
+ .SetDescription("Debug events from the graphics subsystem")
+ .SetTags("debug", "my_custom_tag")
+```
+
+A single trace event can also belong to multiple categories:
+
+```C++
+// Event in the "rendering" and "benchmark" categories.
+TRACE_EVENT("rendering,benchmark", ...);
+```
+
+A corresponding category group entry must be added to the category registry:
+
+```C++
+perfetto::Category::Group("rendering,benchmark")
+```
+
+It's also possible to efficiently query whether a given category is enabled
+for tracing:
+
+```C++
+if (TRACE_EVENT_CATEGORY_ENABLED("rendering")) {
+ // ...
+}
+```
+
+The `TrackEventConfig` field in Perfetto's `TraceConfig` can be used to
+select which categories are enabled for tracing:
+
+```protobuf
+message TrackEventConfig {
+ // Each list item is a glob. Each category is matched against the lists
+ // as explained below.
+ repeated string disabled_categories = 1; // Default: []
+ repeated string enabled_categories = 2; // Default: []
+ repeated string disabled_tags = 3; // Default: [“slow”, “debug”]
+ repeated string enabled_tags = 4; // Default: []
+}
+```
+
+To determine if a category is enabled, it is checked against the filters in the
+following order:
+
+1. Exact matches in enabled categories.
+2. Exact matches in enabled tags.
+3. Exact matches in disabled categories.
+4. Exact matches in disabled tags.
+5. Pattern matches in enabled categories.
+6. Pattern matches in enabled tags.
+7. Pattern matches in disabled categories.
+8. Pattern matches in disabled tags.
+
+If none of the steps produced a match, the category is enabled by default. In
+other words, every category is implicitly enabled unless specifically disabled.
+For example:
+
+| Setting | Needed configuration |
+| ------------------------------- | -------------------------------------------- |
+| Enable just specific categories | `enabled_categories = [“foo”, “bar”, “baz”]` |
+| | `disabled_categories = [“*”]` |
+| Enable all non-slow categories | (Happens by default.) |
+| Enable specific tags | `disabled_tags = [“*”]` |
+| | `enabled_tags = [“foo”, “bar”]` |
+
+## Dynamic and test-only categories
+
+Ideally all trace categories should be defined at compile time as shown
+above, as this ensures trace points will have minimal runtime and binary size
+overhead. However, in some cases trace categories can only be determined at
+runtime (e.g., they come from instrumentation in a dynamically loaded JavaScript
+running in a WebView or in a NodeJS engine). These can be used by trace points
+as follows:
+
+```C++
+perfetto::DynamicCategory dynamic_category{"nodejs.something"};
+TRACE_EVENT(dynamic_category, "SomeEvent", ...);
+```
+
+TIP: It's also possible to use dynamic event names by passing `nullptr` as
+ the name and filling in the `TrackEvent::name` field manually.
+
+Some trace categories are only useful for testing, and they should not make
+it into a production binary. These types of categories can be defined with a
+list of prefix strings:
+
+```C++
+PERFETTO_DEFINE_TEST_CATEGORY_PREFIXES(
+ "test", // Applies to test.*
+ "dontship" // Applies to dontship.*.
+);
+```
+
+## Performance
+
+Perfetto's trace points are designed to have minimal overhead when tracing is
+disabled while providing high throughput for data intensive tracing use
+cases. While exact timings will depend on your system, there is a
+[microbenchmark](/src/tracing/api_benchmark.cc) which gives some ballpark
+figures:
+
+| Scenario | Runtime on Pixel 3 XL | Runtime on ThinkStation P920 |
+| -------- | --------------------- | ---------------------------- |
+| `TRACE_EVENT(...)` (disabled) | 2 ns | 1 ns |
+| `TRACE_EVENT("cat", "name")` | 285 ns | 630 ns |
+| `TRACE_EVENT("cat", "name", <lambda>)` | 304 ns | 663 ns |
+| `TRACE_EVENT("cat", "name", "key", value)` | 354 ns | 664 ns |
+| `DataSource::Trace(<lambda>)` (disabled) | 2 ns | 1 ns |
+| `DataSource::Trace(<lambda>)` | 133 ns | 58 ns |
+
+## Advanced topics
+
+### Tracks
+
+Every track event is associated with a track, which specifies the timeline
+the event belongs to. In most cases, a track corresponds to a visual
+horizontal track in the Perfetto UI like this:
+
+
+
+Events that describe parallel sequences (e.g., separate
+threads) should use separate tracks, while sequential events (e.g., nested
+function calls) generally belong on the same track.
+
+Perfetto supports three kinds of tracks:
+
+- `Track` – a basic timeline.
+
+- `ProcessTrack` – a timeline that represents a single process in the system.
+
+- `ThreadTrack` – a timeline that represents a single thread in the system.
+
+Tracks can have a parent track, which is used to group related tracks
+together. For example, the parent of a `ThreadTrack` is the `ProcessTrack` of
+the process the thread belongs to. By default, tracks are grouped under the
+current process's `ProcessTrack`.
+
+A track is identified by a uuid, which must be unique across the entire
+recorded trace. To minimize the chances of accidental collisions, the uuids
+of child tracks are combined with those of their parents, with each
+`ProcessTrack` having a random, per-process uuid.
+
+By default, track events (e.g., `TRACE_EVENT`) use the `ThreadTrack` for the
+calling thread. This can be overridden, for example, to mark events that
+begin and end on a different thread:
+
+```C++
+void OnNewRequest(size_t request_id) {
+ // Open a slice when the request came in.
+ TRACE_EVENT_BEGIN("category", "HandleRequest", perfetto::Track(request_id));
+
+ // Start a thread to handle the request.
+ std::thread worker_thread([=] {
+ // ... produce response ...
+
+ // Close the slice for the request now that we finished handling it.
+ TRACE_EVENT_END("category", perfetto::Track(request_id));
+ });
+```
+Tracks can also optionally be annotated with metadata:
+
+```C++
+auto desc = track.Serialize();
+desc.set_name("MyTrack");
+perfetto::TrackEvent::SetTrackDescriptor(track, desc);
+```
+
+Threads and processes can also be named in a similar way, e.g.:
+
+```C++
+auto desc = perfetto::ProcessTrack::Current().Serialize();
+desc.mutable_process()->set_process_name("MyProcess");
+perfetto::TrackEvent::SetTrackDescriptor(
+ perfetto::ProcessTrack::Current(), desc);
+```
+
+The metadata remains valid between tracing sessions. To free up data for a
+track, call EraseTrackDescriptor:
+
+```C++
+perfetto::TrackEvent::EraseTrackDescriptor(track);
+```
+
+### Interning
+
+Interning can be used to avoid repeating the same constant data (e.g., event
+names) throughout the trace. Perfetto automatically performs interning for
+most strings passed to `TRACE_EVENT`, but it's also possible to also define
+your own types of interned data.
+
+First, define an interning index for your type. It should map to a specific
+field of
+[interned_data.proto](/protos/perfetto/trace/interned_data/interned_data.proto)
+and specify how the interned data is written into that message when seen for
+the first time.
+
+```C++
+struct MyInternedData
+ : public perfetto::TrackEventInternedDataIndex<
+ MyInternedData,
+ perfetto::protos::pbzero::InternedData::kMyInternedDataFieldNumber,
+ const char*> {
+ static void Add(perfetto::protos::pbzero::InternedData* interned_data,
+ size_t iid,
+ const char* value) {
+ auto my_data = interned_data->add_my_interned_data();
+ my_data->set_iid(iid);
+ my_data->set_value(value);
+ }
+};
+```
+
+Next, use your interned data in a trace point as shown below. The interned
+string will only be emitted the first time the trace point is hit (unless the
+trace buffer has wrapped around).
+
+```C++
+TRACE_EVENT(
+ "category", "Event", [&](perfetto::EventContext ctx) {
+ auto my_message = ctx.event()->set_my_message();
+ size_t iid = MyInternedData::Get(&ctx, "Repeated data to be interned");
+ my_message->set_iid(iid);
+ });
+```
+
+Note that interned data is strongly typed, i.e., each class of interned data
+uses a separate namespace for identifiers.
+
+[RAII]: https://en.cppreference.com/w/cpp/language/raii
diff --git a/docs/ipc.md b/docs/ipc.md
deleted file mode 100644
index ac7c36a..0000000
--- a/docs/ipc.md
+++ /dev/null
@@ -1,45 +0,0 @@
-# Perfetto IPC
-
-*** note
-**This doc is WIP**, stay tuned.
-<!-- TODO(primiano): write IPC doc. -->
-***
-
-**TL;DR**
-We needed an IPC for Android and Linux which was small, simple, controllable,
-predictable, C++11 friendly and debuggable.
-Our IPC transport is not mandatory outside of Android, you can wrap your own IPC
-transport (e.g., Perfetto uses Mojo in chromium) or just short circuit the
-Perfetto `{Service,Producer,Consumer}` interfaces for IPC-less full in-process
-use.
-
-Key features:
-- Protobuf over a unix-socket.
-- Allows to send file descriptors over the wire: for setting up shared memory
-  and passing the FD for the output trace from a consumer to the service.
-- Service definition uses same protobuf rpc syntax of [gRPC](https://grpc.io)
-- Extremely simple [wire protocol](/protos/perfetto/ipc/wire_protocol.proto).
-- C++11 friendly, allows to bind `std::function` to each request.
-- Leak (un)friendly: tries hard to guarantee that callbacks are left unresolved,
-  using C++11 move semantics.
-- Shutdown / destruction friendly: tries hard to guarantee that no callbacks are
-  issued after the IPC channel is destroyed.
-- Disconnection-friendly: all outstanding requests (and hence pending callbacks)
-  are nack-ed in case of a disconnection (e.g., if the endpoint crashes).
-- Memory friendly: one virtually contiguous cache-friendly rx buffer,
-  madvise()'d when when not used.
-- Debugging friendly: single-thread only, based on non-blocking socket I/O.
-- Binary size friendly: generates one protobuf per message, doesn't have any
-  external dependency.
-- Safe:
-  - The rx buffer has guard regions around.
-  - The wire protocol is based on protobuf.
-  - [Fuzzed](/src/ipc/buffered_frame_deserializer_fuzzer.cc)
-- Offers direct control of socket buffers and overrun/stalling policy.
-- ABI stable.
-
-Realistically will never support:
-  - Multithreading / thread pools.
-  - Congestion or flow control.
-  - Non-data object brokering (e.g. sending a remote interface).
-  - Introspection / reflection.
diff --git a/docs/java-hprof.md b/docs/java-hprof.md
deleted file mode 100644
index b7eef31..0000000
--- a/docs/java-hprof.md
+++ /dev/null
@@ -1,52 +0,0 @@
-# Java Heap Profiling
-
-**Java Heap Profiling requires Android 11.**
-
-Java Heap Profiling allows you to capture a snapshot of the memory use of
-objects managed by ART (Android RunTime). This allows to debug situations
-where a lot of memory is used on the managed heap.
-
-## Quickstart
-
-To grab a profile from your device, run the following command, substituting
-`YOUR_APP_NAME` with the name of the app you want to profile.
-
-```
- echo 'buffers {
-  size_kb: 102400
-  fill_policy: RING_BUFFER
-}
-
-data_sources {
-  config {
-    name: "android.java_hprof"
-    java_hprof_config {
-      process_cmdline: "YOUR_APP_NAME"
-    }
-  }
-}
-
-duration_ms: 10000
-write_into_file: true
-' | adb shell perfetto -c - --out /data/misc/perfetto-traces/profile --txt
-```
-
-Then, pull the data onto your machine.
-
-```
-adb pull /data/misc/perfetto-traces/profile some/path
-```
-
-## Viewing the data
-
-Upload the trace to the [Perfetto UI](https://ui.perfetto.dev) and click on
-diamond marker that shows.
-
-This will present a flamegraph of the memory attributed to the shortest path
-to a garbage-collection root. In general an object is reachable by many paths,
-we only show the shortest as that reduces the complexity of the data displayed
-and is generally the highest-signal.
-
-We aggregate the paths per class name, so if there are two `Foo` objects that
-each retain a `String`, we will show one element for `String` as a child of
-one `Foo`.
diff --git a/docs/long-traces.md b/docs/long-traces.md
deleted file mode 100644
index cc43a8f..0000000
--- a/docs/long-traces.md
+++ /dev/null
@@ -1,167 +0,0 @@
-# Long traces with Perfetto
-
-By default Perfetto keeps the full trace buffer in memory and writes it into the
-destination file (passed with the `-o` cmdline argument) only at the end of the
-trace, to reduce the intrusiveness of the tracing system.
-That, however, limits the max size of the trace to the physical memory size of
-the device.
-
-In some cases (e.g., benchmarks, hard to repro cases) it is desirable to capture
-traces that are way larger than that.
-
-
-To achieve that, Perfetto allows to periodically flush the trace buffers into
-the target file (or stdout) by using some flags in the
-[`TraceConfig`](/protos/perfetto/config/trace_config.proto), specifically:
-
-`bool write_into_file`
-When true drains periodically the trace buffers into the output
-file. When this option is enabled, the userspace buffers need to be just
-big enough to hold tracing data between two periods.
-The buffer sizing depends on the activity of the device. A reasonable estimation
-is ~5-20 MB per second.
-
-`uint32 file_write_period_ms`
-Overrides the default drain period. Shorter periods require a smaller userspace
-buffer but increase the performance intrusiveness of tracing. A minimum interval
-of 100ms is enforced.
-
-`uint64 max_file_size_bytes`
-If set, stops the tracing session after N bytes have been written. Used to
-cap the size of the trace.
-
-For a complete example of a working trace config in long-tracing mode see
-[`/test/configs/long_trace.cfg`](/test/configs/long_trace.cfg)
-
-## Instructions
-These instructions assume you have a working standalone checkout (see
-[instructions here](/docs/build-instructions.md)).
-
-These instructions have been tested as non-root. Many of the steps below can be
-simplified when running as root and are required due to SELinux when running as
-`shell` rather than `root`.
-
-``` bash
-$ cd perfetto
-
-# Prepare for the build (as per instructions linked above).
-$ tools/install-build-deps
-$ tools/gn gen out/mac_release --args="is_debug=false"
-
-# Compiles the textual protobuf into binary format
-# for /test/configs/long_trace.cfg.
-$ tools/ninja -C out/mac_release/ long_trace.cfg.protobuf
-
-# Alternatively, the more verbose variant:
-$ alias protoc=$(pwd)/out/mac_release/protoc
-$ protoc --encode=perfetto.protos.TraceConfig \
-        -I$(pwd) \
-        $(pwd)/protos/perfetto/config/perfetto_config.proto \
-        < /test/configs/long_trace.cfg \
-        > /tmp/long_trace.cfg.protobuf
-
-# Push the config onto the device.
-$ adb push out/mac_release/long_trace.cfg.protobuf /data/local/tmp/long_trace.cfg.protobuf
-
-# Run perfetto.
-# Note: Unless running as root, the output folder must be under
-# /data/misc/perfetto-traces/, or SELinux will cause a failure.
-$ adb shell 'cat /data/local/tmp/long_trace.cfg.protobuf | perfetto -c - -o /data/misc/perfetto-traces/trace --background'
-
-# At this point the trace will start in background. It is possible to detach the
-# usb cable. In order to verify if the trace is still ongoing, just run:
-$ adb shell ps -A | grep perfetto
-
-# While it's running, you should see an entry like this:
-shell        23705     1 2166232  12344 do_sys_poll 7796ef2700 S perfetto
-
-# At the end of the trace, the process will be gone. At this point it is
-# possible to pull the trace.
-$ adb shell gzip -c /data/misc/perfetto-traces/trace -3 | gzip -dc - > ~/trace
-
-# Verify that the trace has not been corrupted by the adb transfer
-$ adb shell sha1sum /data/misc/perfetto-traces/trace
-b9f7a7e3d62638b5d9e880db30f68787c458bb3c  /data/misc/perfetto-traces/trace
-
-$ shasum  ~/trace
-b9f7a7e3d62638b5d9e880db30f68787c458bb3c  /Users/primiano/trace
-```
-
-At this point it is possible to load / process the trace as explained below.
-
-### Get high-level trace stats
-Use the `trace_to_text` binary in `summary` mode. This allows to detect whether
-the buffers were sized appropriatel or any overrun happened, either in the
-kernel ftrace buffer or in the userspace buffer. Look for
-`Events overwritten`, `total_overrun` (kernel ftrace buffer)
-and `chunks_overwritten` (userspace buffer).
-
-`trace_to_text` can be also used to convert the trace from the protobuf format
-to systrace textual version (see `trace_to_text --help`).
-
-
-``` bash
-$ ninja -C out/mac_release trace_to_text
-
-$ out/mac_release/trace_to_text summary < ~/trace
-Ftrace duration: 29737ms
-Boottime duration: 21000ms
--------------------- ftrace --------------------
-▁▄▅▄▄▂▁▄▄▄▅▅▃▄▅▅▃▂▂▁▁▃▄▄▁▁▄▁▁ ▁▁▂▄▄▂▃▂▂▂▁▂▄▁▂▁▁▁
-
---------------------Ftrace Stats-------------------
-Events overwritten: 0
-total_overrun: 0 (= 0 - 0)
-
-----------------Process Tree Stats----------------
-Unique thread ids in process tree: 1372
-Unique thread ids in ftrace events: 1580
-Thread ids with process info: 1325/1580 -> 83 %
-
---------------------Trace Stats-------------------
-Buffer 0
-  bytes_written: 37074960
-  chunks_written: 9087
-  chunks_overwritten: 0
-```
-
-### Load the trace in the UI
-
-*** note
-**The UI and trace processor are WIP, targeting end of Q3-18**.
-<!-- TODO(primiano): update this doc. -->
-***
-
-Open https://ui.perfetto.dev and load the trace there.
-
-### Load the trace in the trace processor
-``` bash
-$ ninja -C out/mac_release trace_processor
-$ out/mac_release/trace_processor_shell ~/trace
-
-trace_processor_shell.cc Trace loaded: 1048.58 MB (197.1 MB/s)
-
-> select tdur/1e9 as runtime_sec, name from (select sum(dur) as tdur, utid from sched group by utid) inner join thread using(utid) order by tdur desc limit 20
-         runtime_sec                 name
--------------------- --------------------
-         2560.695682 PowerManagerSer
-         2532.212882 migration/2
-         2529.064936 migration/3
-         2527.338100 migration/1
-         2526.877703 migration/4
-         2524.508852 migration/5
-         2523.372052 migration/6
-         2522.564051 migration/7
-          100.533405 traced_probes
-           80.585233 Binder:1229_E
-           46.294051 Chrome_IOThread
-           35.251236 .gms.persistent
-           27.716663 SensorService
-           26.818083 CrGpuMain
-           26.199466 m.chrome.canary
-           25.766977 CrRendererMain
-           25.623455 CrRendererMain
-           25.429535 android.bg
-           25.060462 traced
-           23.140243 lowpool[2633]
-```
diff --git a/docs/metrics.md b/docs/metrics.md
deleted file mode 100644
index 27e9c0a..0000000
--- a/docs/metrics.md
+++ /dev/null
@@ -1,355 +0,0 @@
-Writing Perfetto-based metrics
-=============
-
-Contents
----------
-1. Background
-2. The Perfetto Metrics Platform
-3. Writing your first metric - step by step
-4. Breaking down and composing metrics (TBD)
-5. Adding a new metric or editing an existing metric (TBD)
-6. Running a metric over a set of traces (TBD)
-7. Metrics platform as an API (TBD)
-
-Background
----------
-Using traces allows computation of reproducible metrics in a wide range
-of situations; examples include benchmarks, lab tests and on
-large corpuses of traces. In these cases, these metrics allow for direct
-root-causing when a regression is detected.
-
-The Perfetto Metrics Platform
-----------
-The metrics platform (powered by the
-[trace processor](trace-processor.md)) allows metrics authors to write
-SQL queries to generate metrics in the form of protobuf messages or proto text.
-
-We strongly encourage all metrics derived on Perfetto traces to be added to the
-Perfetto repo unless there is a clear usecase (e.g. confidentiality) why these
-metrics should not be publicly available.
-
-In return for upstreaming metrics, authors will have first class support for
-running metrics locally and the confidence that their metrics will remain stable
-as trace processor is developed.
-
-For example, generating the full (human readable) set of Android memory
-metrics on a trace is as simple as:
-```shell
-trace_processor_shell --run-metrics android_mem <trace>
-```
-
-As well as scaling upwards while developing from running on a single trace
-locally to running on a large set of traces, the reverse is also very useful.
-When an anomaly is observed in the metrics of a lab benchmark, you can simply
-download a representative trace and run the same metric locally in shell.
-
-Since the same code is running locally and remotely, you can be confident in
-reproducing the issue and use the power of trace processor and/or the Perfetto
-UI to identify the problem!
-
-Writing your first metric: A Step by Step Guide
-----------
-To begin, all you need is some familiarity with SQL and you're ready to start!
-
-Suppose that want a write a metric which computes the CPU time for every process
-in the trace and lists the names of the top 5 processes (by CPU time)
-and the number of threads which were associated with those processes over its
-lifetime.
-
-*Note:*
-* If you want to jump straight to the code, at the end of this guide, your
-workspace should look something like this [GitHub gist](https://gist.github.com/tilal6991/c221cf0cae17e298dfa82b118edf9080). See Step 0 and 4
-below as to where to get trace processor and how to run it to output the
-metrics.
-
-### Step 0
-As a setup step, you'll want to create a folder to act as a scratch workspace;
-this folder will be referred to using the env variable `$WORKSPACE` in Step 4.
-
-The other thing you'll need is trace processor shell. You can download this
-[here](https://get.perfetto.dev/trace_processor) or you can build from source
-using the instructions [here](trace-processor.md). Whichever method is
-chosen, $TRACE_PROCESSOR env variable will be used to refer to the location of
-the binary in Step 4.
-
-### Step 1
-As all metrics in the metrics platform are defined using protos, the metric
-needs to be strctured as a proto. For this metric, there needs to be some notion
-of a process name along with its CPU time and number of threads.
-
-Starting off, in a file named `top_five_processes.proto` in our workspace,
-let's create a basic proto message called ProcessInfo with those three fields:
-```protobuf
-message ProcessInfo {
-  optional string process_name = 1;
-  optional uint64 cpu_time_ms = 2;
-  optional uint32 num_threads = 3;
-}
-```
-
-Next up is a wrapping message which will hold the repeated field containing
-the top 5 processes.
-```protobuf
-message TopProcesses {
-  repeated ProcessInfo process_info = 1;
-}
-```
-
-Finally, let's define an extension to the root proto for all metrics -
-the
-[TraceMetrics](https://android.googlesource.com/platform/external/perfetto/+/HEAD/protos/perfetto/metrics/metrics.proto#39)
-proto).
-```protobuf
-extend TraceMetrics {
-  optional TopProcesses top_processes = 450;
-}
-```
-Adding this extension field allows trace processor to link the newly defined
-metric to the `TraceMetrics` proto.
-
-*Notes:*
-* The field ids 450-500 are reserved for local development so you can use
-any of them as the field id for the extension field.
-* The choice of field name here is important as the SQL file and the final
-table generated in SQL will be based on this name.
-
-Putting everything together, along with some boilerplate header information
-gives:
-```protobuf
-syntax = "proto2";
-
-package perfetto.protos;
-
-import "protos/perfetto/metrics/metrics.proto";
-
-message ProcessInfo {
-  optional string process_name = 1;
-  optional int64 cpu_time_ms = 2;
-  optional uint32 num_threads = 3;
-}
-
-message TopProcesses {
-  repeated ProcessInfo process_info = 1;
-}
-
-extend TraceMetrics {
-  optional TopProcesses top_processes = 450;
-}
-```
-
-### Step 2
-Let's write the SQL to generate the table of the top 5 processes ordered
-by the sum of the CPU time they ran for and the number of threads which were
-associated with the process. The following SQL should be to a file called
-`top_five_processes.sql` in your workspace:
-```sql
-CREATE VIEW top_five_processes_by_cpu
-SELECT
-  process.name as process_name,
-  CAST(SUM(sched.dur) / 1e6 as INT64) as cpu_time_ms,
-  COUNT(DISTINCT utid) as num_threads
-FROM sched
-INNER JOIN thread USING(utid)
-INNER JOIN process USING(upid)
-GROUP BY process.name
-ORDER BY cpu_time_ms DESC
-LIMIT 5;
-```
-Let's break this query down:
-1. The first table used is the `sched` table. This contains all the
-   scheduling data available in the trace. Each scheduling "slice" is associated
-   with a thread which is uniquely identified in Perfetto traces using its
-   `utid`. The two pieces of information which needed from the sched table
-   is the `dur` - short for duration, this is the amount of time the slice
-   lasted - and the `utid` which will be use to join with the thread table.
-2. The next table is the thread table. This gives us a lot of information which
-   are not particularly interested (including its thread name) but it does give
-   us the `upid`. Similar to `utid`, `upid` is the unique identifier for a
-   process in a Perfetto trace. In this case, `upid` will refer to the process
-   which hosts the thread given by `utid`.
-3. The final table is the process table. This gives the name of the
-   process associated with the original sched slice.
-4. With the process, thread and duration for each sched slice, all the slices
-   for a single processes are collected and their durations summed to get the
-   CPU time (dividing by 1e6 as sched's duration is in nanoseconds) and count
-   the number of distinct threads.
-5. Finally, we order by the cpu time and take limit to the top 5.
-
-### Step 3
-Now that the result of the metric has been expressed as an SQL table, it needs
-to be converted a proto. The metrics platform has built-in support for emitting
-protos using SQL functions; something which is used extensively in this step.
-
-Let's look at how it works for our table above.
-```sql
-CREATE VIEW top_processes_output AS
-SELECT TopProcesses(
-  'process_info', (
-    SELECT RepeatedField(
-      ProcessInfo(
-        'process_name', process_name,
-        'cpu_time_ms', cpu_time_ms,
-        'num_threads', num_threads
-      )
-    )
-    FROM top_five_processes_by_cpu
-  )
-);
-```
-Let's break this down again:
-1. Starting from the inner-most SELECT statement, there is
-   what looks like a function call to the ProcessInfo function; in face this is
-   no conincidence. For each proto that the metrics platform knows about,
-   it generates a SQL function with the same name as the proto. This function
-   takes key value pairs with the key as the name of the proto field to fill
-   and the value being the data to store in the field. The output is the proto
-   created by writing the fields described in the function! (*)
-
-   In this case, this function is called once for each row in
-   the `top_five_processes_by_cpu` table. The output of will be the fully filled
-   ProcessInfo proto.
-
-   The call to the `RepeatedField` function is the most interesting part and
-   also the most important. In technical terms, `RepeatedField` is an aggregate
-   function; practically, this means that it takes a full table of values and
-   generates a single array which contains all the values passed to it.
-
-   Therefore, the output of this whole SELECT statement is an array of
-   5 ProcessInfo protos.
-2. Next is creation of the `TopProcesses` proto. By now, the syntax should
-   already feel somewhat familiar; the proto builder function is called
-   to fill in the `process_info` field with the array of protos from the
-   inner funciton.
-
-   The output of this SELECT is a single `TopProcesses` proto containing
-   the ProcessInfos as a repeated field.
-3. Finally, the view is created. This view is specially named to allow the
-   metrics platform to query it to obtain the root proto for each metric (in
-   this case `TopProcesses`). See the note below as to the pattern behind
-   this view's name.
-
-(*) - side note: this is not strictly true. To type-check the protos, we
-also return some metadata about the type of the proto but this is unimportant
-for metric authors
-
-*Note:*
-* It is important that the views be named
-  {name of TraceMetrics extension field}_output. This is the pattern used
-  and expected by the metrics platform for all metrics.
-
-And that's all the SQL we need to write! Our final file should look like so:
-```sql
-CREATE VIEW top_five_processes_by_cpu AS
-SELECT
-  process.name as process_name,
-  CAST(SUM(sched.dur) / 1e6 as INT64) as cpu_time_ms,
-  COUNT(DISTINCT utid) as num_threads
-FROM sched
-INNER JOIN thread USING(utid)
-INNER JOIN process USING(upid)
-GROUP BY process.name
-ORDER BY cpu_time_ms DESC
-LIMIT 5;
-
-CREATE top_processes_output AS
-SELECT TopProcesses(
-  'process_info', (
-    SELECT RepeatedField(
-      ProcessInfo(
-        'process_name', process_name,
-        'cpu_time_ms', cpu_time_ms,
-        'num_threads', num_threads
-      )
-    )
-    FROM top_five_processes_by_cpu
-  )
-);
-```
-
-*Notes:*
-* The name of the SQL file should be the same as the name of TraceMetrics
-  extension field. This is to allow the metrics platform to associated the
-  proto extension field with the SQL which needs to be run to generate it.
-
-### Step 4
-This is the last step and where we get to see the results of our work!
-
-For this step, all we need is a one-liner, invoking trace processor
-shell (see Step 0 for downloading it):
-```shell
-$TRACE_PROCESSOR --run-metrics $WORKSPACE/top_five_processes.sql $TRACE 2> /dev/null
-```
-(If you want a example trace to test this on, see the Notes section below.)
-
-By passing the SQL file for the metric we want to compute, trace processor uses
-the name of this file to both find the proto and also to figure out the name
-of the output table for the proto and the name of the extension field for
-`TraceMetrics`; this is why it was important to choose the names of these other
-objects carefully.
-
-*Notes:*
-* If something doesn't work as intended, check that your workspace looks the
-  same as the contents of this [GitHub gist](https://gist.github.com/tilal6991/c221cf0cae17e298dfa82b118edf9080).
-* A good example trace for this metric is the Android example trace used by
-  the Perfetto UI found [here](https://storage.googleapis.com/perfetto-misc/example_android_trace_30s_1)
-* We're redirecting stderror to remove any noise from parsing the trace that
-  trace processor generates.
-
-If everything went successfully, you should see something like the following
-(this is specifically the output for the Android example trace linked above):
-```
-[perfetto.protos.top_five_processes] {
-  process_info {
-    process_name: "com.google.android.GoogleCamera"
-    cpu_time_ms: 15154
-    num_threads: 125
-  }
-  process_info {
-    process_name: "sugov:4"
-    cpu_time_ms: 6846
-    num_threads: 1
-  }
-  process_info {
-    process_name: "system_server"
-    cpu_time_ms: 6809
-    num_threads: 66
-  }
-  process_info {
-    process_name: "cds_ol_rx_threa"
-    cpu_time_ms: 6684
-    num_threads: 1
-  }
-  process_info {
-    process_name: "com.android.chrome"
-    cpu_time_ms: 5125
-    num_threads: 49
-  }
-}
-```
-
-### Conclusion
-That finishes the introductory guide to writing an metric using the Perfetto
-metrics platform! For more information about where to go next, the following
-links may be useful:
-* To understand what data is available to you and how the SQL tables are
-  structured see the [trace processor](trace-processor.md) docs.
-* To see how you can use the RUN_METRIC function to extract common snippets of
-  SQL and reuse them for writing bigger metrics, continue reading!
-* To see how you can add your own metrics to the platform or edit an existing
-  metric, continue reading!
-
-Breaking down and composing metrics
-----------
-Coming soon!
-
-Adding a new metric or editing an existing metric
-----------
-Coming soon!
-
-Running a metric over a set of traces
-----------
-Coming soon!
-
-Metrics platform as an API
-----------
-Coming soon!
diff --git a/docs/multi-layer-tracing.md b/docs/multi-layer-tracing.md
deleted file mode 100644
index b344f56..0000000
--- a/docs/multi-layer-tracing.md
+++ /dev/null
@@ -1,22 +0,0 @@
-# Multi layer tracing
-
-*** note
-**This doc is WIP**, stay tuned.
-<!-- TODO(primiano): write multi-layer tracing doc. -->
-***
-
-This doc should explain how is possible to compose a hierarchy of tracing
-services. The concrete use case is combining multiprocess tracing in Chromium
-with Android's tracing daemons (think to hypervisors' nested page tables).
-
-The TL;DR of the trick is:
-- ABI stability of the
-  [shared_memory_abi.h](/include/perfetto/ext/tracing/core/shared_memory_abi.h)
-- ABI stability of the IPC surface.
-
-The tracing service in chromium should proxy Producer connections (adapting Mojo
-to our IPC) towards the Android's `traced` service, passing back the shared
-memory buffers to the real producers (the Chrome child process).
-
-Conceptually it is simple and straightforward, requires *some* care to implement
-correctly ownership of the shared memory buffers though.
diff --git a/docs/protozero.md b/docs/protozero.md
deleted file mode 100644
index 28ce9a1..0000000
--- a/docs/protozero.md
+++ /dev/null
@@ -1,28 +0,0 @@
-ProtoZero
----------
-
-*** note
-**This doc is WIP**, stay tuned.
-<!-- TODO(primiano): write protozero doc. -->
-***
-
-ProtoZero is an almost* zero-copy zero-malloc append-only protobuf library.
-It's designed to be fast and efficient at the cost of a reduced API
-surface for generated stubs. The main limitations consist of:
-- Append-only interface: no readbacks are possible from the stubs.
-- No runtime checks for duplicated or missing mandatory fields.
-- Mandatory ordering when writing of nested messages: once a nested message is
-  started it must be completed before adding any fields to its parent.
-
-*** aside
-Allocations and library calls will happen only when crossing the boundary of a
-contiguous buffer (e.g., to request a new buffer to continue the write).
-Assuming a chunk size (a trace *chunk* is what becomes a *contiguous buffer*
-within ProtoZero) of 4KB, and an average event size of 32 bytes, only 7 out of
-1000 events will hit malloc / ipc / library calls.
-***
-
-
-Other resources
----------------
-* [Design doc](https://goo.gl/EKvEfa)
diff --git a/docs/quickstart/android-tracing.md b/docs/quickstart/android-tracing.md
new file mode 100644
index 0000000..1bbe8b6
--- /dev/null
+++ b/docs/quickstart/android-tracing.md
@@ -0,0 +1,143 @@
+# Quickstart: Record traces on Android
+
+`perfetto` allows you to collect system-wide performance traces from Android
+devices from a variety of data sources (kernel scheduler via ftrace, userspace
+instrumentation via atrace and all other data sources listed in this site).
+
+## Starting the tracing services
+
+Due to Perfetto's [service-based architecture](/docs/concepts/service-model.md)
+, the `traced` and `traced_probes` services need to be running to record traces.
+
+These services are shipped on Android system images by default since Android 9
+(Pie) but are not always enabled by default.
+On Android 9 (P) and 10 (Q) those services are enabled by default only on Pixel
+phones and must be manually enabled on other phones.
+Since Android 11 (R), perfetto services are enabled by default on most devices.
+
+To enable perfetto services run:
+
+```bash
+# Will start both traced and traced_probes.
+adb shell setprop persist.traced.enable 1
+```
+
+## Recording a trace
+
+You can collect a trace in the following ways:
+
+* Through the record page in the [Perfetto UI](https://ui.perfetto.dev).
+* Using the `perfetto` command line interface [[reference](/docs/reference/perfetto-cli.md)].
+
+### Perfetto UI
+
+Navigate to ui.perfetto.dev and select **Record new trace**.
+
+From this page, select and turn on the data sources you want to include in the trace. More detail about the different data sources can be found in the
+_Data sources_ section of the docs.
+
+
+
+If you are unsure, start by turning on **Scheduling details** under the **CPU** tab.
+
+Ensure your device is connected and select **Add ADB device**. Once your device has successfully paired (you may need to allow USB debugging on the device), select the **Start Recording** button.
+
+Allow time for the trace to be collected (10s by default) and then you should see the trace appear.
+
+
+
+Your trace may look different depending on which data sources you enabled.
+
+### Perfetto cmdline
+
+#### Short syntax
+
+If you are already familiar with `systrace` or `atrace`, there is an equivalent syntax with `perfetto`:
+
+```bash
+adb shell perfetto -o mytrace.pftrace -t 20s sched freq idle am wm gfx view
+```
+
+#### Full trace config
+
+The short syntax allows to enable only a subset of the data sources; for full
+control of the trace config, pass the full trace config in input.
+
+See the [_Trace configuration_ page](/docs/concepts/config.md) and the examples
+in each data source doc page for detailed instructions about how to configure
+all the various knobs of Perfetto.
+
+If you are running on a Mac or Linux host, or are using a bash-based terminal
+on Windows, you can use the following:
+
+```bash
+adb shell perfetto \
+ -c - --txt \
+ -o /data/misc/perfetto-traces/trace \
+<<EOF
+duration_ms: 10000
+
+buffers: {
+ size_kb: 8960
+ fill_policy: DISCARD
+}
+buffers: {
+ size_kb: 1280
+ fill_policy: DISCARD
+}
+data_sources: {
+ config {
+ name: "linux.ftrace"
+ ftrace_config {
+ ftrace_events: "sched/sched_switch"
+ ftrace_events: "power/suspend_resume"
+ ftrace_events: "sched/sched_process_exit"
+ ftrace_events: "sched/sched_process_free"
+ ftrace_events: "task/task_newtask"
+ ftrace_events: "task/task_rename"
+ ftrace_events: "ftrace/print"
+ atrace_categories: "gfx"
+ atrace_categories: "view"
+ atrace_categories: "webview"
+ atrace_categories: "camera"
+ atrace_categories: "dalvik"
+ atrace_categories: "power"
+ }
+ }
+}
+data_sources: {
+ config {
+ name: "linux.process_stats"
+ target_buffer: 1
+ process_stats_config {
+ scan_all_processes_on_start: true
+ }
+ }
+}
+
+EOF
+```
+
+In all other cases, first push the trace config file and then invoke perfetto:
+```bash
+adb push config.txt /data/local/tmp/trace_config.txt
+abb shell 'perfetto --txt -c - -o /data/misc/perfetto-traces/trace < /data/local/tmp/trace_config.txt'
+```
+
+NOTE: because of strict SELinux rules, on versions of older than Android 11
+(R) passing directly the file path as `-c /data/local/tmp/config` might fail,
+hence the `-c -` + stdin piping above.
+
+Pull the file using `adb pull /data/misc/perfetto-traces/trace ~/trace.pftrace`
+and upload to the [Perfetto UI](https://ui.perfetto.dev).
+
+The full reference for the `perfetto` cmdline interface can be found
+[here](/docs/reference/perfetto-cli.md).
+
+## On-device System Tracing app
+
+Since Android 9 (P) it's possible to collect a trace directly from the device
+using the System Tracing app, from Developer Settings.
+
+See https://developer.android.com/topic/performance/tracing/on-device for
+instructions.
diff --git a/docs/quickstart/heap-profiling.md b/docs/quickstart/heap-profiling.md
new file mode 100644
index 0000000..6e9bb26
--- /dev/null
+++ b/docs/quickstart/heap-profiling.md
@@ -0,0 +1,45 @@
+# Quickstart: Heap profiling
+
+## Prerequisites
+
+* A host running macOS or Linux.
+* A device running Android 10+.
+* A _Profileable_ or _Debuggable_ app. If you are running on a _"user"_ build of
+ Android (as opposed to _"userdebug"_ or _"eng"_), your app needs to be marked
+ as profileable or debuggable in its manifest.
+ See the [heapprofd documentation][hdocs] for more details.
+
+[hdocs]: /docs/data-sources/native-heap-profiler.md#heapprofd-targets
+
+## Capture a heap profile
+
+Download the `tools/heap_profile` (if you don't have a perfetto checkout) and
+run it as follows:
+
+```bash
+curl -LO https://raw.githubusercontent.com/google/perfetto/master/tools/heap_profile
+chmod +x heap_profile
+
+./heap_profile -n system_server
+
+Profiling active. Press Ctrl+C to terminate.
+You may disconnect your device.
+
+Wrote profiles to /tmp/profile-1283e247-2170-4f92-8181-683763e17445 (symlink /tmp/heap_profile-latest)
+These can be viewed using pprof. Googlers: head to pprof/ and upload them.
+```
+
+## View profile
+
+Upload the `raw-trace` file from the output directory to the [Perfetto UI](
+https://ui.perfetto.dev) and click on diamond marker in the UI track labeled
+_"Heap profile"_.
+
+
+
+
+## Next steps
+
+Learn more about memory debugging in the [Memory Usage on Android Guide](
+/docs/case-studies/memory.md) and more about the [heapprofd data-source](
+/docs/data-sources/native-heap-profiler.md)
diff --git a/docs/quickstart/linux-tracing.md b/docs/quickstart/linux-tracing.md
new file mode 100644
index 0000000..a88942f
--- /dev/null
+++ b/docs/quickstart/linux-tracing.md
@@ -0,0 +1,78 @@
+# Quickstart: Record traces on Linux
+
+Perfetto can capture system traces on Linux. All ftrace-based data sources
+and most other procfs / sysfs-based data sources are supported.
+
+Currently there are no packages or prebuilts for Linux. In order to run Perfetto
+on Linux you need to build it from source.
+
+## Building from source
+
+1. Check out the code:
+```bash
+git clone https://android.googlesource.com/platform/external/perfetto/ && cd perfetto
+```
+
+2. Download and extract build dependencies:
+```bash
+tools/install-build-deps
+```
+_If the script fails with SSL errors, try invoking it as `python3 tools/install-build-deps`, or upgrading your openssl libraries._
+
+3. Generate all most common GN build configurations:
+```bash
+tools/build_all_configs.py
+```
+
+4. Build the Linux tracing binaries (On Linux it uses a hermetic clang toolchain, downloaded as part of step 2):
+```bash
+tools/ninja -C out/linux_clang_release traced traced_probes perfetto
+```
+_This step is optional when using the convenience `tools/tmux` script below._
+
+## Capturing a trace
+
+Due to Perfetto's [service-based architecture](/docs/concepts/service-model.md),
+in order to capture a trace, the `traced` (session daemon) and `traced_probes`
+(probes and ftrace-interop daemon) need to be running.
+
+For a quick start, the [tools/tmux](/tools/tmux) script takes care of building,
+setting up and running everything.
+As an example, let's look at the process scheduling data, which will be obtained
+from the Linux kernel via the [ftrace] interface.
+[ftrace]: https://www.kernel.org/doc/Documentation/trace/ftrace.txt
+
+1. Run the convenience script with an example tracing config (10s duration):
+```
+OUT=out/linux_clang_release CONFIG=test/configs/scheduling.cfg tools/tmux -n
+```
+This will open a tmux window with three panes, one per the binary involved in
+tracing: `traced`, `traced_probes` and the `perfetto` client cmdline.
+
+2. Start the tracing session by running the pre-filled `perfetto` command in
+   the down-most [consumer] pane.
+
+3. Detach from the tmux session with `Ctrl-B D`,or shut it down with
+   `tmux kill-session -t demo`. The script will then copy the trace to
+   `/tmp/trace.protobuf`, as a binary-encoded protobuf (see
+   [TracePacket reference](/docs/reference/trace-packet-proto.autogen)).
+
+## Visualizing the trace
+
+We can now explore the captured trace visually by using a dedicated web-based UI.
+
+NOTE: The UI runs fully in-browser using JavaScript + Web Assembly. The trace
+      file is **not** uploaded anywhere by default, unless you explicitly click
+      on the 'Share' link.
+
+1. Navigate to [ui.perfetto.dev](https://ui.perfetto.dev) in a browser.
+
+2. Click the **Open trace file** on the left-hand menu, and load the captured
+   trace (by default at `/tmp/trace.protobuf`).
+
+3. Explore the trace by zooming/panning using WASD, and mouse for expanding
+   process tracks (rows) into their constituent thread tracks.
+   Press "?" for further navigation controls.
+
+Alternatively, you can explore the trace contents issuing SQL queries through
+the [trace processor](/docs/analysis/trace-processor).
diff --git a/docs/quickstart/trace-analysis.md b/docs/quickstart/trace-analysis.md
new file mode 100644
index 0000000..427f68b
--- /dev/null
+++ b/docs/quickstart/trace-analysis.md
@@ -0,0 +1,324 @@
+# Quickstart: SQL-based analysis and trace-based metrics
+
+_This quickstart explains how to use `trace_processor` to programmatically query
+the trace contents through SQL and compute trace-based metrics._
+
+## Get Trace Processor
+
+TraceProcessor is a multi-format trace importing and query engine based on
+SQLite. It comes both as a C++ library and as a standalone executable:
+`trace_processor_shell` (or just `trace_processor`).
+
+```bash
+# Download prebuilts (Linux and Mac only)
+curl -LO https://get.perfetto.dev/trace_processor
+chmod +x ./trace_processor
+
+# Start the interactive shell
+./trace_processor trace.pftrace
+```
+
+See [Trace Processor docs](/docs/analysis/trace-processor.md) for the full
+TraceProcessor guide.
+
+## Sample queries
+
+For more exhaustive examples see the _SQL_ section of the various _Data sources_
+docs.
+
+### Slices
+
+Slices are stackable events which have name and span some duration of time.
+
+
+
+```
+> SELECT ts, dur, name FROM slice
+ts dur name
+-------------------- -------------------- ---------------------------
+ 261187017446933 358594 eglSwapBuffersWithDamageKHR
+ 261187017518340 357 onMessageReceived
+ 261187020825163 9948 queueBuffer
+ 261187021345235 642 bufferLoad
+ 261187121345235 153 query
+ ...
+```
+
+### Counters
+
+Counters are events with a value which changes over time.
+
+
+
+```
+> SELECT ts, value FROM counter
+ts value
+-------------------- --------------------
+ 261187012149954 1454.000000
+ 261187012399172 4232.000000
+ 261187012447402 14304.000000
+ 261187012535839 15490.000000
+ 261187012590890 17490.000000
+ 261187012590890 16590.000000
+...
+```
+
+### Scheduler slices
+
+Scheduler slices indicate which thread was scheduled on which CPU at which time.
+
+
+
+```
+> SELECT ts, dur, cpu, utid FROM sched
+ts dur cpu utid
+-------------------- -------------------- -------------------- --------------------
+ 261187012170489 267188 0 390
+ 261187012170995 247153 1 767
+ 261187012418183 12812 2 2790
+ 261187012421099 220000 6 683
+ 261187012430995 72396 7 2791
+...
+```
+
+## Trace-based metrics
+
+Trace Processor offers also a higher-level query interface that allows to run
+pre-baked queries, herein called "metrics". Metrics are generally curated by
+domain experts, often the same people who add the instrumentation points in the
+first lace, and output structured JSON/Protobuf/text.
+Metrics allow to get a summarized view of the trace without having to type any
+SQL or having to load the trace in the UI.
+
+The metrics` schema files live in the
+[/protos/perfetto/metrics](/protos/perfetto/metrics/) directory.
+The corresponding SQL queries live in
+[/src/trace_processor/metrics](/src/trace_processor/metrics/).
+
+### Run a single metric
+
+Let's run the [`android_cpu`](/protos/perfetto/metrics/android/cpu_metric.proto)
+metric. This metrics computes the total CPU time and the total cycles
+(CPU frequency * time spent running at that frequency) for each process in the
+trace, breaking it down by CPU (_core_) number.
+
+```protobuf
+./trace_processor --run-metrics android_cpu trace.pftrace
+
+android_cpu {
+ process_info {
+ name: "/system/bin/init"
+ threads {
+ name: "init"
+ core {
+ id: 1
+ metrics {
+ mcycles: 1
+ runtime_ns: 570365
+ min_freq_khz: 1900800
+ max_freq_khz: 1900800
+ avg_freq_khz: 1902017
+ }
+ }
+ core {
+ id: 3
+ metrics {
+ mcycles: 0
+ runtime_ns: 366406
+ min_freq_khz: 1900800
+ max_freq_khz: 1900800
+ avg_freq_khz: 1902908
+ }
+ }
+ ...
+ }
+ ...
+ }
+ process_info {
+ name: "/system/bin/logd"
+ threads {
+ name: "logd.writer"
+ core {
+ id: 0
+ metrics {
+ mcycles: 8
+ runtime_ns: 33842357
+ min_freq_khz: 595200
+ max_freq_khz: 1900800
+ avg_freq_khz: 1891825
+ }
+ }
+ core {
+ id: 1
+ metrics {
+ mcycles: 9
+ runtime_ns: 36019300
+ min_freq_khz: 1171200
+ max_freq_khz: 1900800
+ avg_freq_khz: 1887969
+ }
+ }
+ ...
+ }
+ ...
+ }
+ ...
+}
+```
+
+### Running multiple metrics
+
+Multiple metrics can be flagged using comma separators to the `--run-metrics`
+flag. This will output a text proto with the combined result of running both
+metrics.
+
+```protobuf
+$ ./trace_processor --run-metrics android_mem,android_cpu trace.pftrace
+
+android_mem {
+ process_metrics {
+ process_name: ".dataservices"
+ total_counters {
+ anon_rss {
+ min: 19451904
+ max: 19890176
+ avg: 19837548.157829277
+ }
+ file_rss {
+ min: 25804800
+ max: 25829376
+ avg: 25827909.957489081
+ }
+ swap {
+ min: 9289728
+ max: 9728000
+ avg: 9342355.8421707246
+ }
+ anon_and_swap {
+ min: 29179904
+ max: 29179904
+ avg: 29179904
+ }
+ }
+ ...
+ }
+ ...
+}
+android_cpu {
+ process_info {
+ name: "/system/bin/init"
+ threads {
+ name: "init"
+ core {
+ id: 1
+ metrics {
+ mcycles: 1
+ runtime_ns: 570365
+ min_freq_khz: 1900800
+ max_freq_khz: 1900800
+ avg_freq_khz: 1902017
+ }
+ }
+ ...
+ }
+ ...
+ }
+ ...
+}
+```
+
+### JSON and binary output
+
+The trace processor also supports binary protobuf and JSON as alternative output
+formats. This is useful when the intended reader is an offline tool.
+
+Both single and multiple metrics are supported as with proto text output.
+
+```
+./trace_processor --run-metrics android_mem --metrics-output=binary trace.pftrace
+<binary protobuf output>
+
+./trace_processor --run-metrics android_mem,android_cpu --metrics-output=json trace.pftrace
+{
+ "android_mem": {
+ "process_metrics": [
+ {
+ "process_name": ".dataservices",
+ "total_counters": {
+ "anon_rss": {
+ "min": 19451904.000000,
+ "max": 19890176.000000,
+ "avg": 19837548.157829
+ },
+ "file_rss": {
+ "min": 25804800.000000,
+ "max": 25829376.000000,
+ "avg": 25827909.957489
+ },
+ "swap": {
+ "min": 9289728.000000,
+ "max": 9728000.000000,
+ "avg": 9342355.842171
+ },
+ "anon_and_swap": {
+ "min": 29179904.000000,
+ "max": 29179904.000000,
+ "avg": 29179904.000000
+ }
+ },
+ ...
+ },
+ ...
+ ]
+ }
+ "android_cpu": {
+ "process_info": [
+ {
+ "name": "\/system\/bin\/init",
+ "threads": [
+ {
+ "name": "init",
+ "core": [
+ {
+ "id": 1,
+ "metrics": {
+ "mcycles": 1,
+ "runtime_ns": 570365,
+ "min_freq_khz": 1900800,
+ "max_freq_khz": 1900800,
+ "avg_freq_khz": 1902017
+ }
+ },
+ ...
+ ]
+ ...
+ }
+ ...
+ ]
+ ...
+ },
+ ...
+ ]
+ ...
+ }
+}
+```
+
+## Next steps
+
+There are several options for exploring more of the trace analysis features
+Perfetto provides:
+
+* The [trace conversion quickstart](/docs/quickstart/traceconv.md) gives an
+ overview on how to convert Perfetto traces to legacy formats to integrate with
+ existing tooling.
+* The [Trace Processor documentation](/docs/analysis/trace-processor.md) gives
+ more information about how to work with trace processor including details on
+ how to write queries and how tables in trace processor are organized.
+* The [metrics documentation](/docs/analysis/metrics.md) gives a more in-depth
+ look into metrics including a short walkthrough on how to build an
+ experimental metric from scratch.
+* The [SQL table reference](/docs/analysis/sql-tables.autogen) gives a
+ comprehensive guide to the all the available tables in trace processor.
+* The [common tasks](/docs/contributing/common-tasks.md) page gives a list of
+ steps on how new metrics can be added to the trace processor.
diff --git a/docs/quickstart/traceconv.md b/docs/quickstart/traceconv.md
new file mode 100644
index 0000000..226e5b2
--- /dev/null
+++ b/docs/quickstart/traceconv.md
@@ -0,0 +1,43 @@
+# Quickstart: Trace conversion
+
+_This quickstart demonstrates how Perfetto traces can be converted into other trace formats using the `traceconv` tool._
+
+
+
+## Prerequisites
+
+- A host running Linux or MacOS
+- A Perfetto protobuf trace file
+
+The supported output formats are:
+
+- `text` - protobuf text format: a text based representation of protos
+- `json` - Chrome JSON format: the format used by chrome://tracing
+- `systrace`: the ftrace text format used by Android systrace
+- `profile` (heap profiler only): pprof-like format. This is only valid for
+ traces with [native heap profiler](/docs/data-sources/native-heap-profiler.md)
+ dumps.
+
+## Setup
+
+```bash
+curl -LO https://get.perfetto.dev/traceconv
+chmod +x traceconv
+./traceconv [text|json|systrace|profile] [input proto file] [output file]
+```
+
+## Converting to systrace text format
+
+`./traceconv systrace [input proto file] [output systrace file]`
+
+## Converting to Chrome Tracing JSON format
+
+`./traceconv json [input proto file] [output json file]`
+
+## Opening in the legacy systrace UI
+
+If you just want to open a Perfetto trace with the legacy (Catapult) trace
+viewer, you can just navigate to [ui.perfetto.dev](https://ui.perfetto.dev),
+and use the the _"Open with legacy UI"_ link. This runs `traceconv` within
+the browser using WebAssembly and passes the converted trace seamlessly to
+chrome://tracing.
diff --git a/docs/recording-traces.md b/docs/recording-traces.md
deleted file mode 100644
index 1a5f0f1..0000000
--- a/docs/recording-traces.md
+++ /dev/null
@@ -1,103 +0,0 @@
-# Recording traces
-
-Perfetto provides a few different ways for recording traces:
-
-1. With the [Perfetto UI](#tracing-with-perfetto-ui). This is the most
-   convenient way to get started.
-
-2. With the [`perfetto` command line tool](#tracing-on-the-command-line) on
-   Android. This is a good match for automated testing.
-
-3. With the [Perfetto Client API](#tracing-with-the-api). This provides the
-   most control when Perfetto is integrated in your app.
-
-## Tracing with the API
-
-> The [Perfetto SDK example](https://github.com/skyostil/perfetto-sdk-example)
-> demonstrates trace recording through the API.
-
-> Tracing is currently only supported with the in-process Perfetto service
-> (perfetto::kInProcessBackend).
-
-In order to record a trace, you should first initialize a
-[TraceConfig](../protos/perfetto/config/trace_config.proto) message which
-specifies what type of data to record. If your app includes track events
-(i.e, `TRACE_EVENT`), you typically want to choose the categories which are
-enabled for tracing. By default, all non-debug categories are enabled, but
-you can enable a specific one like this:
-
-```C++
-perfetto::protos::gen::TrackEventConfig track_event_cfg;
-track_event_cfg.add_disabled_categories("*");
-track_event_cfg.add_enabled_categories("rendering");
-```
-
-Next, build the main trace config together with the track event part:
-
-```C++
-perfetto::TraceConfig cfg;
-cfg.add_buffers()->set_size_kb(1024);  // Record up to 1 MiB.
-auto* ds_cfg = cfg.add_data_sources()->mutable_config();
-ds_cfg->set_name("track_event");
-ds_cfg->set_track_event_config_raw(track_event_cfg.SerializeAsString());
-```
-
-If your app includes a custom data source, you can also enable it here:
-
-```C++
-ds_cfg = cfg.add_data_sources()->mutable_config();
-ds_cfg->set_name("my_data_source");
-```
-
-Read more about [advanced trace config features](trace-config.md). After
-building the trace config, you can begin tracing:
-
-```C++
-std::unique_ptr<perfetto::TracingSession> tracing_session(
-    perfetto::Tracing::NewTrace());
-tracing_session->Setup(cfg);
-tracing_session->StartBlocking();
-```
-
-> Tip: API methods with `Blocking` in their name will suspend the calling
-> thread until the respective operation is complete. There are typically also
-> asynchronous versions of each function to that don't have this limitation.
-
-Now that tracing is active, instruct your app to perform the operation you
-want to record. After that, we can stop tracing and collect the
-protobuf-formatted trace data:
-
-```C++
-tracing_session->StopBlocking();
-std::vector<char> trace_data(tracing_session->ReadTraceBlocking());
-
-// Write the trace into a file.
-std::ofstream output;
-output.open("example.pftrace", std::ios::out | std::ios::binary);
-output.write(&trace_data[0], trace_data.size());
-output.close();
-```
-
-To save memory with longer traces, you can also tell Perfetto to write
-directly into a file by passing a file descriptor into Setup(), remembering
-to close the file after tracing is done:
-
-```C++
-int fd = open("example.pftrace", O_RDWR | O_CREAT | O_TRUNC, 0600);
-tracing_session->Setup(cfg, fd);
-tracing_session->StartBlocking();
-// ...
-tracing_session->StopBlocking();
-close(fd);
-```
-
-The resulting trace file can be directly opened in the [Perfetto
-UI](https://ui.perfetto.dev) or the [Trace Processor](trace-processor.md).
-
-## Tracing with Perfetto UI
-
-TODO(skyostil).
-
-## Tracing on the command line
-
-TODO(skyostil).
diff --git a/docs/reference/heap_profile-cli.md b/docs/reference/heap_profile-cli.md
new file mode 100644
index 0000000..457b699
--- /dev/null
+++ b/docs/reference/heap_profile-cli.md
@@ -0,0 +1,42 @@
+# heap_profile
+
+`tools/heap_profile` allows to collect native memory profiles on Android.
+See [Recording traces](/docs/data-sources/native-heap-profiler.md) for more
+details about the data-source.
+
+```
+usage: heap_profile [-h] [-i INTERVAL] [-d DURATION] [--no-start] [-p PIDS]
+                    [-n NAMES] [-c CONTINUOUS_DUMP] [--disable-selinux]
+                    [--no-versions] [--no-running] [--no-startup]
+                    [--shmem-size SHMEM_SIZE] [--block-client]
+                    [--block-client-timeout BLOCK_CLIENT_TIMEOUT]
+                    [--no-block-client] [--idle-allocations] [--dump-at-max]
+                    [--disable-fork-teardown] [--simpleperf]
+                    [--trace-to-text-binary TRACE_TO_TEXT_BINARY]
+                    [--print-config] [-o DIRECTORY]
+```
+
+## Options
+|Option|Description|
+|---|---|
+| -n, --name | Comma-separated list of process names to profile. |
+| -p, --pid | Comma-separated list of PIDs to profile. |
+| -i, --interval | Sampling interval. Default 4096 (4KiB) |
+| -o, --output | Output directory. |
+| -d, --duration | Duration of profile (ms). Default 7 days. |
+| --block-client | When buffer is full, block the client to wait for buffer space. Use with caution as this can significantly slow down the client. This is the default |
+| --no-block-client | When buffer is full, stop the profile early. |
+| --block-client-timeout | If --block-client is given, do not block any allocation for longer than this timeout (us). |
+| -h, --help | Show this help message and exit |
+| --no-start | Do not start heapprofd. |
+| -c, --continuous-dump | Dump interval in ms. 0 to disable continuous dump. |
+| --disable-selinux | Disable SELinux enforcement for duration of profile. |
+| --no-versions | Do not get version information about APKs. |
+| --no-running | Do not target already running processes. Requires Android 11. |
+| --no-startup | Do not target processes that start during the profile. Requires Android 11. |
+| --shmem-size | Size of buffer between client and heapprofd. Default 8MiB. Needs to be a power of two multiple of 4096, at least 8192. |
+| --dump-at-max | Dump the maximum memory usage rather than at the time of the dump. |
+| --disable-fork-teardown | Do not tear down client in forks. This can be useful for programs that use vfork. Android 11+ only. |
+| --simpleperf | Get simpleperf profile of heapprofd. This is only for heapprofd development. |
+| --trace-to-text-binary | Path to local trace to text. For debugging. |
+| --print-config | Print config instead of running. For debugging. |
diff --git a/docs/reference/perfetto-cli.md b/docs/reference/perfetto-cli.md
new file mode 100644
index 0000000..d101dee
--- /dev/null
+++ b/docs/reference/perfetto-cli.md
@@ -0,0 +1,76 @@
+# Perfetto CLI
+
+This section describes how to use the `perfetto` commandline binary to capture
+traces. Examples are given in terms of an Android device connected over ADB.
+
+`perfetto` has two modes for configuring the tracing session (i.e. what and how
+to collect):
+
+* __lightweight mode__: all config options are supplied as commandline flags,
+  but the available data sources are restricted to ftrace and atrace. This mode
+  is similar to
+  [`systrace`](https://developer.android.com/topic/performance/tracing/command-line).
+* __normal mode__: the configuration is specified in a protocol buffer. This
+  allows for full customisation of collected traces.
+
+
+## General options
+
+The following table lists the available options when using `perfetto` in either
+mode.
+
+|Option|Description|
+|---|---|
+| `--background \| -d` |Perfetto immediately exits the command-line interface and continues recording your trace in background.|
+|`--out OUT_FILE \| -o OUT_FILE`|Specifies the desired path to the output trace file, or `-` for stdout. `perfetto` writes the output to the file described in the flags above. The output format compiles with the format defined in [AOSP `trace.proto`](/protos/perfetto/trace/trace.proto).|
+|`--dropbox TAG`|Uploads your trace via the [DropBoxManager API](https://developer.android.com/reference/android/os/DropBoxManager.html) using the tag you specify.|
+|`--no-guardrails`|Disables protections against excessive resource usage when enabling the `--dropbox` flag during testing.|
+|`--reset-guardrails`|Resets the persistent state of the guardrails and exits (for testing).|
+|`--query`|Queries the service state and prints it as human-readable text.|
+|`--query-raw`|Similar to `--query`, but prints raw proto-encoded bytes of `tracing_service_state.proto`.|
+|`--help \| -h`|Prints out help text for the `perfetto` tool.|
+
+
+## Lightweight mode
+
+The general syntax for using `perfetto` in *lightweight mode* is as follows:
+
+<pre class="none">
+ adb shell perfetto [ --time <var>TIMESPEC</var> ] [ --buffer <var>SIZE</var> ] [ --size <var>SIZE</var> ]
+           [ <var>ATRACE_CAT</var> | <var>FTRACE_GROUP/FTRACE_NAME</var> | <var>FTRACE_GROUP/*</var> ]...
+</pre>
+
+
+The following table lists the available options when using `perfetto` in
+*lightweight mode*.
+
+|Option|Description|
+|--- |--- |
+|`--time TIME[s\|m\|h] \| -t TIME[s\|m\|h]`|Specifies the trace duration in seconds, minutes, or hours. For example, `--time 1m` specifies a trace duration of 1 minute. The default duration is 10 seconds.|
+|`--buffer SIZE[mb\|gb] \| -b SIZE[mb\|gb`]|Specifies the ring buffer size in megabytes (mb) or gigabytes (gb). The default parameter is `--buffer 32mb`.|
+|`--size SIZE[mb\|gb] \| -s SIZE[mb\|gb]`|Specifies the max file size in megabytes (mb) or gigabytes (gb). By default `perfetto` uses only in-memory ring-buffer.|
+
+
+This is followed by a list of event specifiers:
+
+|Event|Description|
+|--- |--- |
+|`ATRACE_CAT`|Specifies the atrace categories you want to record a trace for. For example, the following command traces Window Manager using atrace: `adb shell perfetto --out FILE wm`. To record other categories, see this [list of atrace categories](https://android.googlesource.com/platform/frameworks/native/+/refs/tags/android-q-preview-5/cmds/atrace/atrace.cpp#100).|
+|`FTRACE_GROUP/FTRACE_NAME`|Specifies the ftrace events you want to record a trace for. For example, the following command traces sched/sched_switch events: `adb shell perfetto --out FILE sched/sched_switch`|
+|`FTRACE_GROUP/*`|Record all events in group (e.g. sched/\*). Specifies the group of ftrace events you want to record a trace for. For example, the following command traces sched/\* events: `adb shell perfetto --out FILE 'sched/*'`|
+
+
+## Normal mode
+
+The general syntax for using `perfetto` in *normal mode* is as follows:
+
+<pre class="none">
+ adb shell perfetto [ --txt ] --config <var>CONFIG_FILE</var>
+</pre>
+
+The following table lists the available options when using `perfetto` in *normal* mode.
+
+|Option|Description|
+|--- |--- |
+|`--config CONFIG_FILE \| -c CONFIG_FILE`|Specifies the path to a configuration file. In normal mode, some configurations may be encoded in a configuration protocol buffer. This file must comply with the protocol buffer schema defined in [AOSP `trace_config.proto`](/protos/perfetto/config/data_source_config.proto). You select and configure the data sources using the DataSourceConfig member of the TraceConfig, as defined in [AOSP `data_source_config.proto`](/protos/perfetto/config/data_source_config.proto).|
+|`--txt`|Instructs `perfetto` to parse the config file as pbtxt. This flag is experimental, and it's not recommended that you enable it for production.|
diff --git a/docs/running.md b/docs/running.md
deleted file mode 100644
index 3d9d937..0000000
--- a/docs/running.md
+++ /dev/null
@@ -1,101 +0,0 @@
-# Running Perfetto
-
-In order to run Perfetto and get a meaningful trace you need to build
-(see [build instructions](build-instructions.md)) and run the following:
-
-`traced`:
-The unprivileged trace daemon that owns the log buffers and maintains
-a registry of Producers and Consumers connected.
-
-`traced_probes`:
-The privileged daemon that has access to the Kernel tracefs
-(typically mounted under `/sys/kernel/debug/tracing`). It drives
-[Ftrace](https://source.android.com/devices/tech/debug/ftrace) and writes its
-protobuf-translated contents into `traced`.
-
-`perfetto`:
-A command line utility client that drive the trace and save back
-the results (either to a file or to [Android's Dropbox][dropbox])
-
-Running from a standalone checkout (Linux, Mac or Android)
--------------------------------------------------------------
-A convenience script allows to run Perfetto daemons (`traced`, `traced_probes`)
-and the command line client (`perfetto`) in a tmux-based terminal:
-```bash
-CONFIG=ftrace.cfg OUT=out/default ./tools/tmux
-```
-
-The script will automatically serialize the trace config defined in the
-`CONFIG` variable (e.g., [this](https://android.googlesource.com/platform/external/perfetto/+/master/test/configs/ftrace.cfg)) into a protobuf and setup the right paths.
-Furthermore it will automatically rebuild if necessary.
-
-It is possible to push binaries to, and run on, a remote target over ssh (even
-when cross-compiling):
-```bash
-CONFIG=ftrace.cfg OUT=out/default SSH_TARGET=user@my-device-host ./tools/tmux
-```
-
-Running from an Android P+ in-tree build
-----------------------------------------
-Make sure that Perfetto daemons (`traced` / `traced_probes`) are running.
-They are enabled by default on Pixel and Pixel 2 (walleye, taimen, marlin,
-sailfish). On other devices start them manually by doing:
-```bash
-adb shell setprop persist.traced.enable 1
-```
-
-If this works you will see something like this in the logs:
-```bash
-$ adb logcat -s perfetto
-perfetto: service.cc:45 Started traced, listening on /dev/socket/traced_producer /dev/socket/traced_consumer
-perfetto: probes.cc:25 Starting /system/bin/traced_probes service
-perfetto: probes_producer.cc:32 Connected to the service
-```
-
-At which point you can grab a trace by doing:
-
-```bash
-$ adb shell perfetto --config :test --out /data/misc/perfetto-traces/trace
-```
-
-For more advanced configurations see the [Trace Config](#trace-config) section.
-
-*** aside
-If the output file is not under `/data/misc/perfetto-traces`, tracing will
-fail due to SELinux.
-***
-
-*** aside
-For security reasons the trace file is written with 0600 (rw-------) permissions
-and owned by shell. On rooted (`userbuild`) devices it is possible to just
-`adb pull` the file after `adb root`. On `user` devices instead, in order to get
-the trace out of the device, do the following:
-`adb shell cat /data/misc/perfetto-traces/trace > ~/trace`
-***
-
-Trace config
-------------
-`--config :test` uses a hard-coded test trace config. It is possible to pass
-an arbitrary trace config. See instructions in the
-[trace config](trace-config.md) page.
-
-Trace UI
---------
-For building the trace UI see the [build instructions](build-instructions.md)
-page. To run the UI using your local build:
-
-```
-$ ui/run-dev-server out/[your_build_dir]
-```
-
-Documentation
--------------
-To run the documentation server using your local build:
-
-```
-$ make -C docs test
-```
-You might need to install `docsify` and `docsify-cli`
-(`$ npm i -g docsify docsify-cli`) before running the documentation server.
-
-[dropbox]: https://developer.android.com/reference/android/os/DropBoxManager.html
diff --git a/docs/toc.md b/docs/toc.md
index 6e36fce..f095fe4 100644
--- a/docs/toc.md
+++ b/docs/toc.md
@@ -1,33 +1,65 @@
-* Development workflow
-  * [Contributing](contributing.md)
-  * [Build instructions](build-instructions.md)
-  * [Running tests](testing.md)
-* Instrumenting and tracing
-  * [App instrumentation](app-instrumentation.md)
-  * [Recording traces](recording-traces.md)
-* On-device tracer
-  * [Running Perfetto](running.md)
-  * [Capturing long traces](long-traces.md)
-  * [Advanced trace config](trace-config.md)
-  * [Running in detached mode](detached-mode.md)
-  * [Native Heap Profiling](heapprofd.md)
-  * [Java Heap Profiling](java-hprof.md)
-* Offline trace processing
-  * [Trace processor](trace-processor.md)
-  * [Trace analysis](analysis.md)
-  * [Trace-based metrics](metrics.md)
-  * [Trace conversion](traceconv.md)
-  * [Clock synchronization](clock-sync.md)
-* Architectural docs
-  * [Key concepts](architecture.md)
-  * [Life of a tracing session](life-of-a-tracing-session.md)
-  * [Ftrace interop](ftrace.md)
-  * [Performance benchmarks](benchmarks.md)
-  * [Trace format](trace-format.md)
-  * [Multi-layer tracing](multi-layer-tracing.md)
-  * [Security model](security-model.md)
-  * [Embedding Perfetto](embedder-guide.md)
-  * [ProtoZero internals](protozero.md)
-  * [IPC internals](ipc.md)
-  * [heapprofd Design](heapprofd-design.md)
-  * [heapprofd Design: Wire Protocol](heapprofd-wire-protocol.md)
+* [Overview](README.md)
+
+* [Quickstart](#)
+  * [Record traces on Android](quickstart/android-tracing.md)
+  * [Record traces on Linux](quickstart/linux-tracing.md)
+  * [SQL analysis and metrics](quickstart/trace-analysis.md)
+  * [Trace conversion](quickstart/traceconv.md)
+  * [Heap profiling](quickstart/heap-profiling.md)
+
+* [Case studies](#)
+  * [Debugging memory usage](case-studies/memory.md)
+
+* [Data sources](#)
+  * [Memory](#)
+    * [Counters and events](data-sources/memory-counters.md)
+    * [Native heap profiler](data-sources/native-heap-profiler.md)
+    * [Java heap profiler](data-sources/java-heap-profiler.md)
+  * [CPU](#)
+    * [Scheduling events](data-sources/cpu-scheduling.md)
+    * [System calls](data-sources/syscalls.md)
+    * [Frequency scaling](data-sources/cpu-freq.md)
+  * [Power](#)
+    * [Battery counters and rails](data-sources/battery-counters.md)
+  * [Android system](#)
+    * [Atrace instrumentation](data-sources/atrace.md)
+    * [Android log (logcat)](data-sources/android-log.md)
+
+* [App Instrumentation](#)
+  * [Tracing SDK](instrumentation/tracing-sdk.md)
+  * [Track events](instrumentation/track-events.md)
+
+* [Trace analysis](#)
+  * [Trace Processor (SQL)](analysis/trace-processor.md)
+  * [Trace-based metrics](analysis/metrics.md)
+  * [SQL tables](analysis/sql-tables.autogen)
+  * [Stats table](analysis/sql-stats.autogen)
+
+* [Core concepts](#)
+  * [Trace configuration](concepts/config.md)
+  * [Buffers and dataflow](concepts/buffers.md)
+  * [Service model](concepts/service-model.md)
+  * [Clock synchronization](concepts/clock-sync.md)
+  * [Detached mode](concepts/detached-mode.md)
+
+* [Reference](#)
+  * [Trace Config proto](reference/trace-config-proto.autogen)
+  * [Trace Packet proto](reference/trace-packet-proto.autogen)
+  * [perfetto cmdline](reference/perfetto-cli.md)
+  * [heap_profile cmdline](reference/heap_profile-cli.md)
+
+* [Contributing](#)
+    * [Getting started](contributing/getting-started.md)
+    * [Build instructions](contributing/build-instructions.md)
+    * [Running tests](contributing/testing.md)
+    * [Common tasks](contributing/common-tasks.md)
+    * [Embedding Perfetto](contributing/embedding.md)
+
+* [Design documents](#)
+    * [API and ABI surface](design-docs/api-and-abi.md)
+    * [Heapprofd design](design-docs/heapprofd-design.md)
+    * [Heapprofd wire protocol](design-docs/heapprofd-wire-protocol.md)
+    * [Life of a tracing session](design-docs/life-of-a-tracing-session.md)
+    * [Perfetto CI](design-docs/continuous-integration.md)
+    * [ProtoZero](design-docs/protozero.md)
+    * [Security model](design-docs/security-model.md)
diff --git a/docs/trace-config.md b/docs/trace-config.md
deleted file mode 100644
index e7c0f80..0000000
--- a/docs/trace-config.md
+++ /dev/null
@@ -1,82 +0,0 @@
-# Perfetto trace config
-
-*** note
-**This doc is WIP**, stay tuned.
-<!-- TODO(primiano): write trace config doc. -->
-***
-
-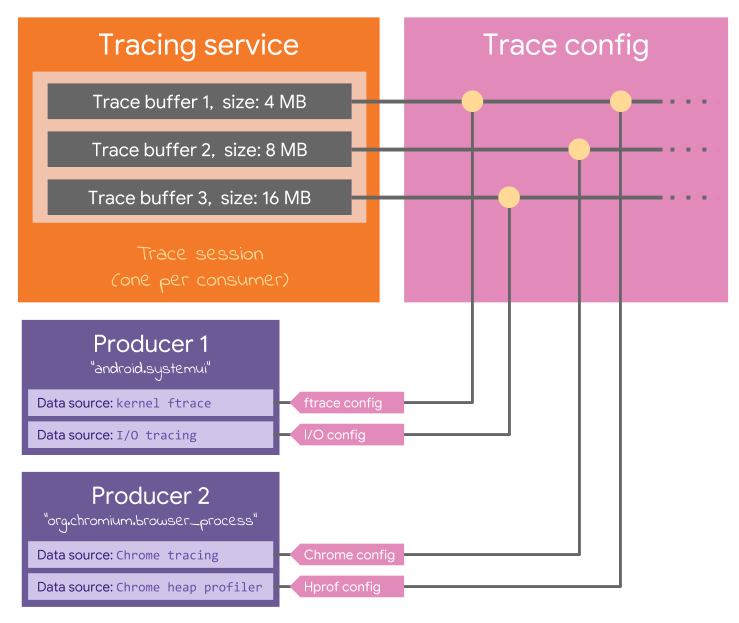
-
-The [`TraceConfig`](/protos/perfetto/config/trace_config.proto) is an extensible
-protobuf message, sent by the consumer to the service, that defines:
-- The number and size of the trace buffer.
-- The duration of the trace.
-- [optionally] a file descriptor for the output trace and a periodic write
- interval. If omitted the trace is kept only in memory.
-- The producers involved in the trace session.
-- The data sources involved in the trace session.
-- The configuration of each data source.
-- The crossbar mapping between each data source and the trace buffers.
-
-Each data source can create its own specialized schema for the config, like
-[this](/protos/perfetto/config/ftrace/ftrace_config.proto)
-
-See [`trace_config.proto`](/protos/perfetto/config/trace_config.proto) for more
-details.
-
-For convenience, a vulcanized trace config where all the nested protobuf
-sub-message definitions are squashed together is available in
-[`perfetto_config.proto`](/protos/perfetto/config/perfetto_config.proto).
-
-
-Specifying a custom trace config
---------------------------------
-```bash
-cat > /tmp/config.txpb <<EOF
-# This is a text-encoded protobuf for /protos/perfetto/config/trace_config.proto
-duration_ms: 10000
-
-# For long traces set the following variables. It will periodically drain the
-# trace buffers into the output file, allowing to save a trace larger than the
-# buffer size.
-write_into_file: true
-file_write_period_ms: 5000
-
-buffers {
- size_kb: 10240
-}
-
-data_sources {
- config {
- name: "linux.ftrace"
- target_buffer: 0
- ftrace_config {
- buffer_size_kb: 40 # Kernel ftrace buffer size.
- ftrace_events: "sched_switch"
- ftrace_events: "print"
- }
- }
-}
-
-data_sources {
- config {
- name: "linux.process_stats"
- target_buffer: 0
- }
-}
-EOF
-
-protoc=$(pwd)/out/android/gcc_like_host/protoc
-
-$protoc --encode=perfetto.protos.TraceConfig \
- -I$(pwd)/external/perfetto \
- $(pwd)/external/perfetto/protos/perfetto/config/perfetto_config.proto \
- < /tmp/config.txpb \
- > /tmp/config.pb
-
-cat /tmp/config.pb | adb shell perfetto -c - -o /data/misc/perfetto-traces/trace.pb
-adb shell cat /data/misc/perfetto-traces/trace.pb > /tmp/trace.pb
-out/android/trace_to_text json < /tmp/trace.pb > /tmp/trace.json
-
-# The file can now be viewed in chrome://tracing
-```
diff --git a/docs/trace-format.md b/docs/trace-format.md
deleted file mode 100644
index ec6c3eb..0000000
--- a/docs/trace-format.md
+++ /dev/null
@@ -1,33 +0,0 @@
-# Perfetto trace format
-
-*** note
-**This doc is WIP**, stay tuned.
-<!-- TODO(primiano): write trace format doc. -->
-***
-
-A Perfetto trace is guaranteed to be a a linear sequence of `TracePacket(s)`
-(see [trace_packet.proto](/protos/perfetto/trace/trace_packet.proto)).
-
-As a key part of the Perfetto design, the tracing service is agnostic of the
-content of TracePacket, modulo few fields (e.g., `trusted_packed_*`,
-clock snapshots, copy of the original config) that are produced by the service
-itself.
-
-Each data source can extend the trace with their app-specific protobuf schema.
-*** aside
-TODO(primiano): we should reserve an extension range and figure out / comment a
-hash to assign sub-message IDs, even without checking them into
-trace_packet.proto.
-***
-
-
-**Linearity guarantees**
-The tracing service guarantees that all `TracePacket(s)` written by a given
-`TraceWriter` are seen in-order, without gaps or duplicates. If, for any reason,
-a `TraceWriter` sequence becomes invalid, no more packets are returned to the
-Consumer (or written into the trace file).
-
-However, `TracePacket(s)` written by different `TraceWriter` (hence even
-different producers) can be seen in no particular order.
-The consumer can re-establish a total order, if interested, using the packet
-timestamps (after having synchronized the different clocks onto a global clock).
diff --git a/docs/trace-processor.md b/docs/trace-processor.md
deleted file mode 100644
index 532056b..0000000
--- a/docs/trace-processor.md
+++ /dev/null
@@ -1,305 +0,0 @@
-# Trace Processor
-
-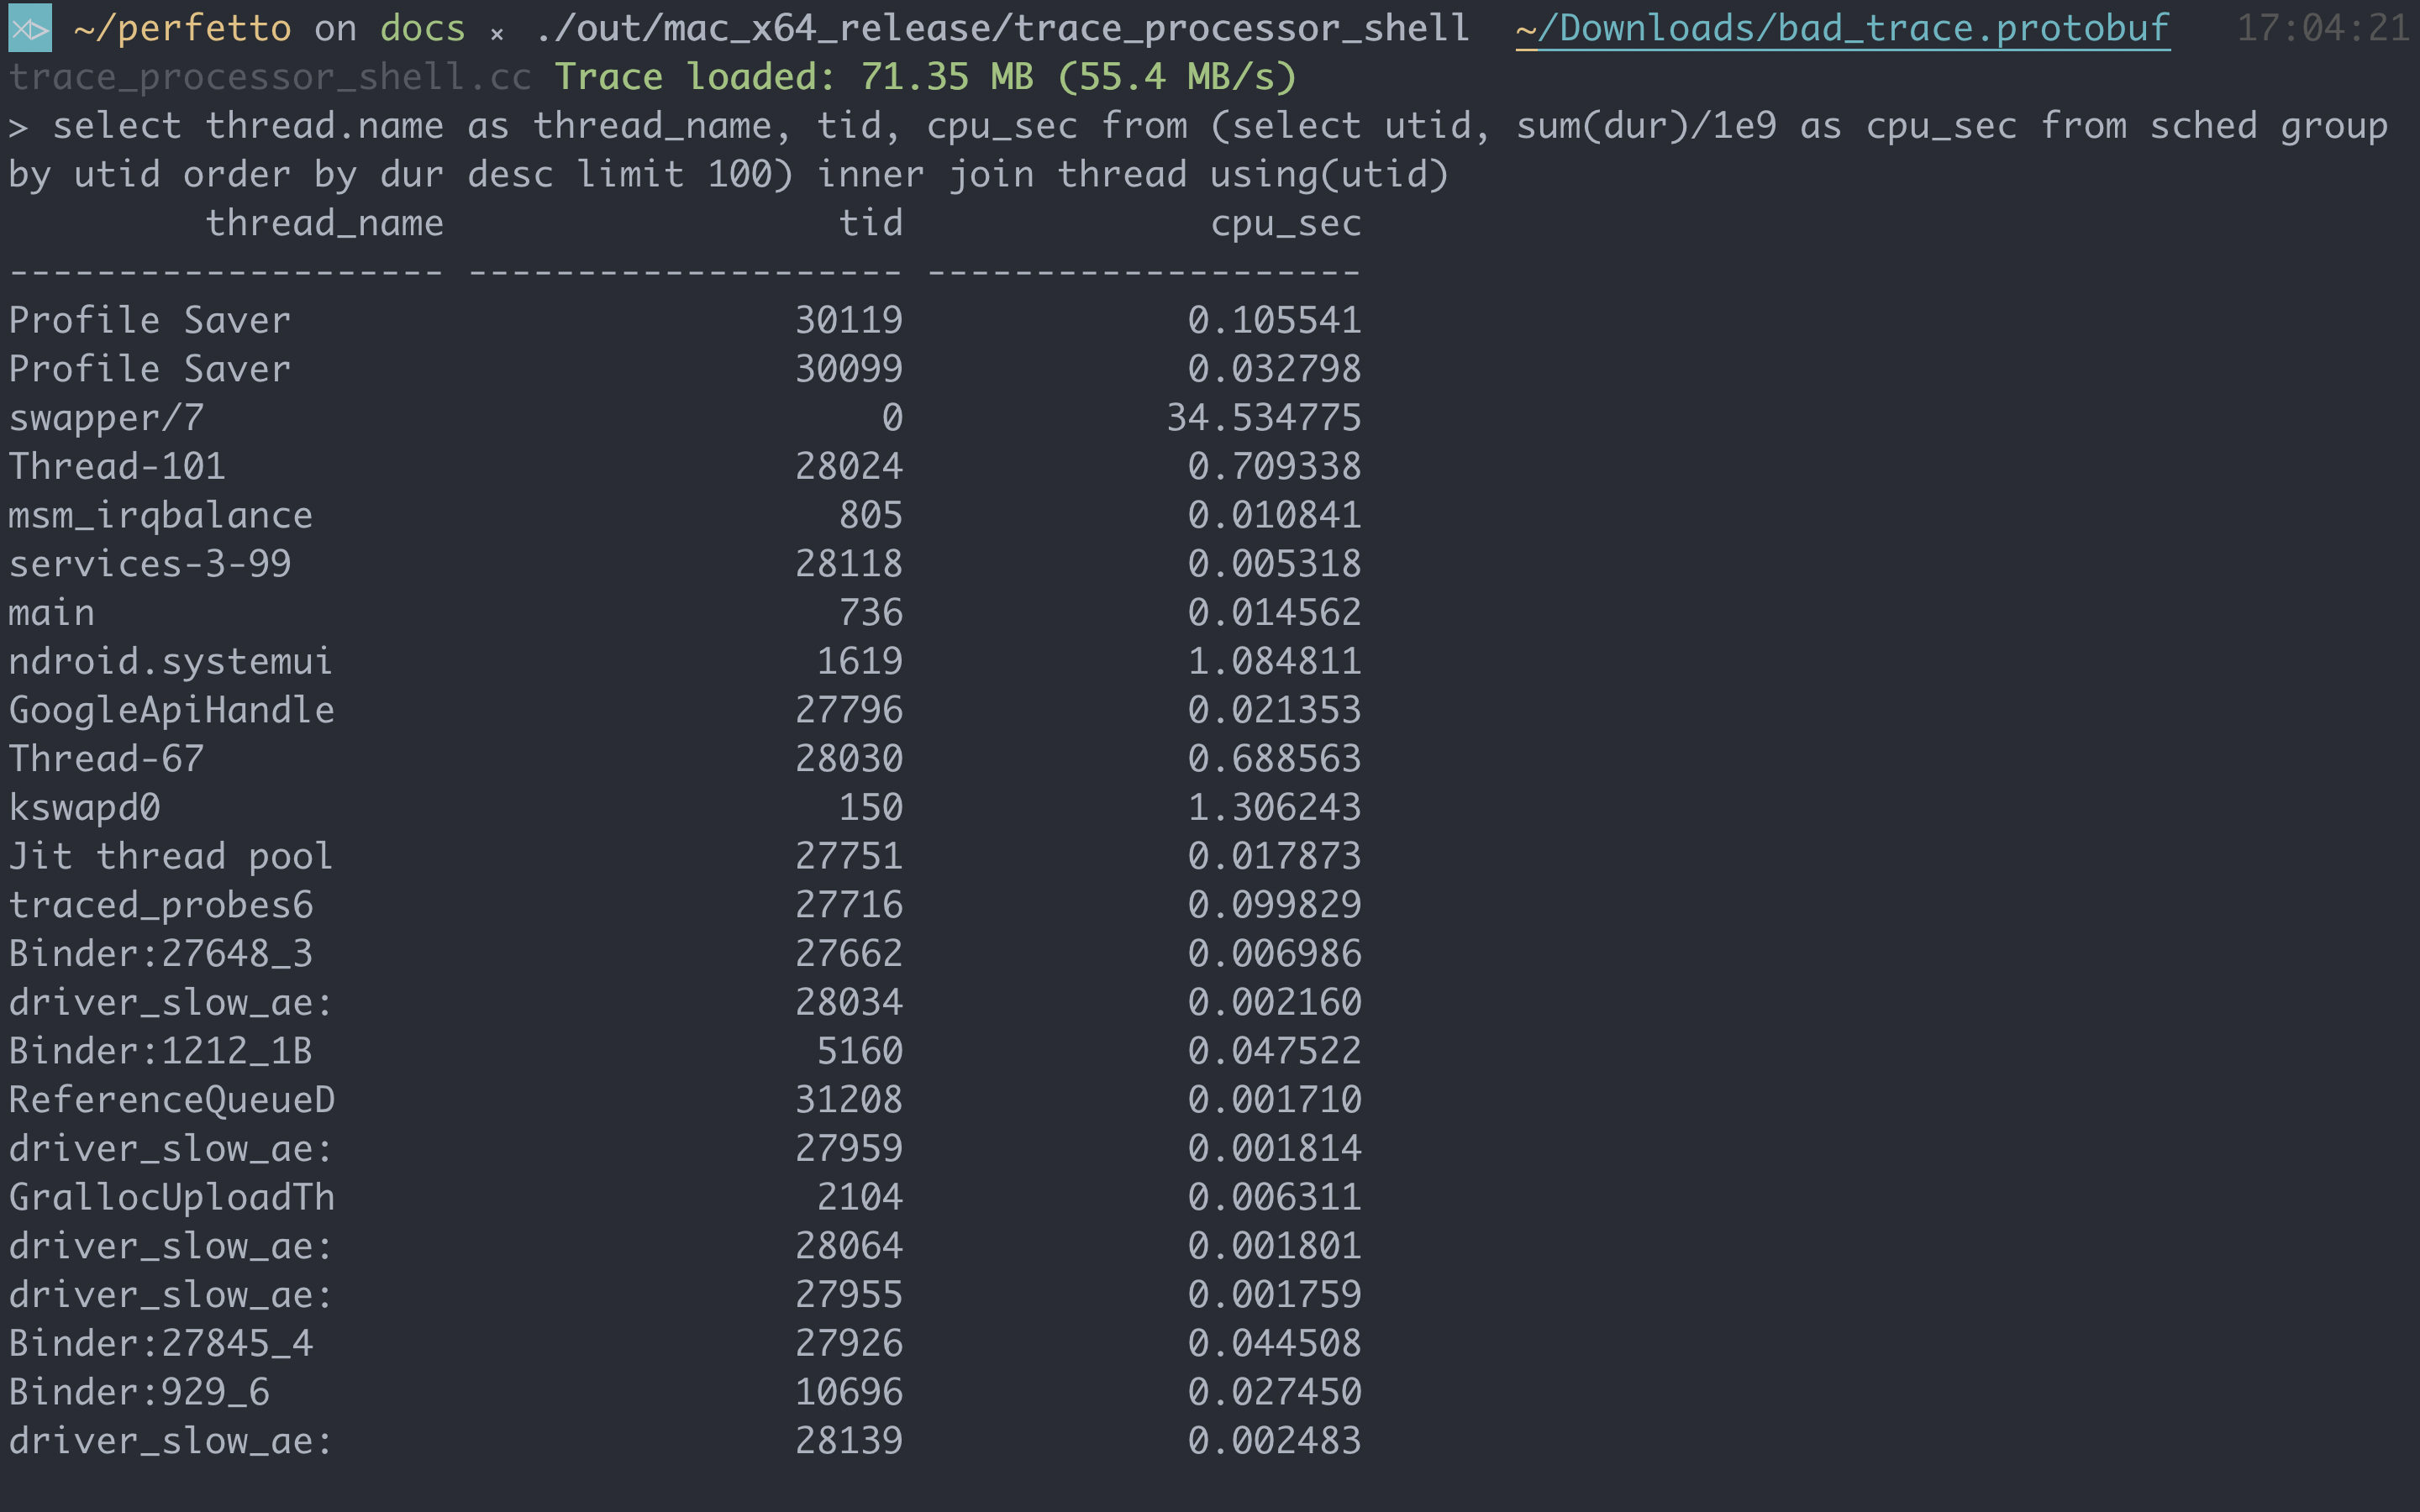
-
-The Trace Processor is a C++ library
-([/src/trace_processor](/src/trace_processor)) that is able to ingest traces of
-various format and expose them in a massaged, higher level format, queryable
-through SQL queries. The trace processor is used:
-* By the [Perfetto UI](https://ui.perfetto.dev/), in the form of a
- Web Assembly module.
-* Standalone:
- * using the [prebuilt](http://get.perfetto.dev/trace_processor) binaries.
- * using the `trace_processor_shell` target from source
- (`ninja -C out/xxx trace_processor_shell`).
-* In internal pipelines for batch processing.
-
-Supported input formats:
- * Perfetto .proto traces
- * [Partial support] Chrome .json trace events
- * [NOT IMPLEMENTED YET] ftrace format as per `/sys/kernel/debug/tracing/trace`.
-
-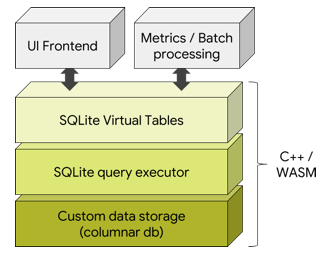
-
-Rationale
----------
-Traces are raw because they are optimized for fast & low overhead writing.
-Despite being protos, their output is not ideal for being consumed by third
-parties as-is. Some data massaging is required.
-Examples:
-* Ftrace sched_switch events only provide thread names and thread IDs.
- In order to attribute execution times to the package/process that data needs
- to be joined with the process_tree events to join TIDs with their parent PID
- and process name.
-* Even after this join, sched_switch events produce two slices (one at the
- beginning, one at the end) per sched event. What most consumers want to see
- instead is one "interval" per thread execution time-slice.
-* Similarly ftrace ext4 events provide only inode numbers and those need to be
- joined with inode->path events.
-
-
-Schema
-------
-
-### sched table
-The sched table holds data about scheduling slices in the trace.
-
-`ts`
-Timestamp of the scheduling event, in nanoseconds. This comes from the
-CLOCK_BOOTTIME, when available.
-
-`dur`
-Duration of the scheduling event, in nanoseconds.
-
-`utid`
-ID of the thread. This is NOT the UNIX pid/tid (see below).
-This can be joined with the thread table.
-
-`cpu`
-CPU number where the scheduling event happened.
-
-
-### counters table
-The counters table contains the data about counter events (both kernel
-and userspace) in the trace. This includes sources like memory, battery,
-cpufreq events etc.
-
-`id`
-A unique identifier for the counter row.
-
-`ts`
-The timestamp of the counter event.
-
-`name`
-The name of the counter event.
-
-`value`
-The value of the counter event.
-
-`ref`
-The identifier of the `ref`erence metadata associated with the counter event.
-See ref_type for what data this can contain.
-
-`ref_type`
-The type of reference metadata associated to the counter event. Will be one
-of the following values `utid` (the ref is an identifier for the thread table),
-`upid` (same for process table), `cpu` (the cpu the event occurred on), `irq`
-and `softirq`.
-
-`arg_set_id`
-The identifier into the args table. (see below)
-
-
-### instants table
-The instants table contains the data about instant events (both kernel
-and userspace) in the trace. This includes sources like the lmk, sched_wakeup
-events etc.
-
-`id`
-A unique identifier for the instant row.
-
-`ts`
-The timestamp of the instant event.
-
-`name`
-The name of the instant event.
-
-'value'
-The value of the instant event.
-
-`ref`
-The identifier of the `ref`erence metadata associated with the instant event.
-See ref_type for what data this can contain.
-
-`ref_type`
-The type of reference metadata associated to the instant event. Will be one
-of the following values `utid` (the ref is an identifier for the thread table),
-`upid` (same for process table), `cpu` (the cpu the event occurred on), `irq`
-and `softirq`.
-
-`arg_set_id`
-The identifier into the args table. (see below)
-
-
-### slices table
-The slices table holds data about the userspace slices (from Chrome or Android)
-seen in the trace. These slices can be nested within each other forming 'stacks'
-of slices.
-
-`ts`
-The timestamp of the userspace slice in nanoseconds.
-
-`dur`
-Duration of the userspace slice, in nanoseconds.
-
-`utid`
-ID of the thread. This is NOT the UNIX pid/tid (see below).
-This can be joined with the thread table.
-
-`cat`
-The category of the slice. Only non-null and meaningful for Chrome traces.
-
-`name`
-The name of the slice.
-
-`depth`
-The nesting depth of the slice within the stack. Starts at 0 for root slices
-and counts upward for child slices.
-
-`stack_id`
-A unique identifier for the whole stack of slices to the current point. This
-identifier is useful when deriving metrics on unique stacks of slices.
-
-`parent_stack_id`
-The 'stack_id' for the parent stack of slices. This is 0 for all root slices
-and a reference to a 'stack_id' otherwise.
-
-
-### process table
-The process table holds data about the processes seen in the trace.
-
-`upid`
-Unique process ID. This is NOT the UNIX pid. This is a sequence number generated
-by the trace processor to uniquely identify a process in the trace. This is to
-deal with the fact that UNIX pids can be recycled and two distinct processes
-which lifetimes don't overlap can be assigned the same pid.
-
-`name`
-Process name, as per /proc/pid/cmdline.
-
-`pid`
-The UNIX pid (also known as Thread Group ID in Linux). This also matches the
-tid of the process' main thread.
-
-
-Example:
-
-| upid | name | pid |
-|-------------------|--------------------|--------------------|
-| 1 | /system/bin/logd | 601 |
-| 2 | rcu_preempt | 7 |
-| 3 | rcuop/4 | 44 |
-| 4 | rcuop/6 | 60 |
-
-### thread table
-The thread table holds data about the threads seen in the trace.
-
-`utid`
-Unique thread ID. This is NOT the Linux pid or tid. Like the above, this is a
-sequence number generated by the trace processor to uniquely identify a thread
-in the trace.
-
-`upid`
-ID of the parent process in the `process` table.
-This can be used to JOIN a thread with its process.
-
-`name`
-Thread name, as per /proc/pid/task/tid/comm.
-
-`tid`
-The Linux thread id (confusingly named "pid" in the Linux-world).
-For the process' main thread `tid` == `tgid` == `pid`.
-
-Example:
-
-| utid | upid | name | tid |
-|--------|-------|------------------|------|
-| 1 | 1 | logd.klogd | 632 |
-| 2 | 2 | rcu_preempt | 7 |
-| 3 | 4 | rcuop/6 | 60 |
-| 4 | 6 | rcuop/3 | 36 |
-| 5 | 8 | sugov:0 | 588 |
-| 6 | 9 | kworker/u16:6 | 9283 |
-| 7 | 12 | sensors@1.0-ser | 1021 |
-| 8 | 12 | HwBinder:797_1 | 1626 |
-
-
-### stats table
-The stats table holds the statistics from the trace collection tool
-as well as counters from the trace processor collected during parsing and
-ingesting the trace
-
-`name`
-The name of the stat.
-
-`idx`
-The index of the stat in the array. This value is only non-null for
-stats which are indexed (e.g. ftrace overrun events are indexed per CPU).
-
-`severity`
-The severity of the value indicated by the stat. Can be one of 'info' and
-'error'.
-
-`source`
-The source of the stat i.e. whether is is coming from the trace collection
-time or parsing/ingestion time. One of 'trace' (i.e. trace collection time)
-or 'analysis' (parsing/ingestion time).
-
-`value`
-The value of the statistic.
-
-
-### args table
-The args table is a generic store of key value pairs deduplicated across the
-entire trace. A 'set' of arguments is given a unique identifier and can be
-referenced from other tables.
-
-`arg_set_id`
-The identifier for the set of arguments this arg belongs to.
-
-`flat_key`
-The key of the arg excluding any indexing for args which are arrays.
-
-`key`
-The long form key of the arg (including any indexes for array args.)
-
-`int_value`, `real_value`, `string_value`
-The value of the arg. One of these columns will be non-null depending on the
-type of the arg with the other two being null.
-
-
-Sample queries for the `sched` (sched_switch events) table
-----------------------------------------------------------
-
-### Trace duration
-``` sql
-select ((select max(ts) from sched) - (select min(ts) from sched)) / 1e9 as duration_sec
-```
-
-### Total CPU usage
-``` sql
-select cpu, sum(dur)/1e9 as cpu_time_sec from sched group by cpu order by cpu
-```
-
-### List all processes
-``` sql
-select process.name, pid from process limit 100
-```
-
-### List all processes and threads
-``` sql
-select process.name as proc_name, pid, thread.name as thread_name, tid from thread left join process using(upid) limit 100
-```
-
-### CPU time for top 100 threads
-``` sql
-select thread.name as thread_name, tid, cpu_sec from (select utid, sum(dur)/1e9 as cpu_sec from sched group by utid order by dur desc limit 100) inner join thread using(utid)
-```
-
-With matching process names
-``` sql
-select thread.name as thread_name, process.name as proc_name, tid, pid, cpu_sec from (select utid, sum(dur)/1e9 as cpu_sec from sched group by utid order by dur desc limit 100) left outer join thread using(utid) left outer join process using(upid)
-```
-
-### CPU time for top 100 processes
-``` sql
-select process.name, tot_proc/1e9 as cpu_sec from (select upid, sum(tot_thd) as
-tot_proc from (select utid, sum(dur) as tot_thd from sched group by utid) join
-thread using(utid) group by upid) join process using(upid) order by cpu_sec desc
-limit 100;
-```
-
-### CPU time for top 100 processes broken down by cpu
-``` sql
-select proc_name, cpu, cpu_sec from (select process.name as proc_name, upid, cpu, cpu_sec from (select cpu, utid, sum(dur)/1e9 as cpu_sec from sched group by utid) left join thread using(utid) left join process using(upid)) group by upid, cpu order by cpu_sec desc limit 100
-```
diff --git a/docs/traceconv.md b/docs/traceconv.md
deleted file mode 100644
index deb951c..0000000
--- a/docs/traceconv.md
+++ /dev/null
@@ -1,38 +0,0 @@
-# Converting between trace formats
-
-Perfetto traces can be converted into other trace formats using the
-`traceconv` tool.
-
-The formats supported today are:
- * proto text format: the standard text based representation of protos
- * Chrome JSON format: the format used by chrome://tracing
- * systrace format: the ftrace text format used by Android systrace
- * profile format (heap profiler only): pprof-like format.
-   This is only valid for traces with
-   [heap profiler](src/profiling/memory/README.md) dumps.
-
-traceconv is also used in the UI to convert Perfetto traces to the Chrome
-JSON format and directly open these traces in the legacy systrace UI
-(Catapult's chrome://tracing).
-
-Usage
----------
-```
-curl https://get.perfetto.dev/traceconv -o traceconv
-chmod +x traceconv
-./traceconv [text|json|systrace|profile] [input proto file] [output file]
-```
-
-Examples
----------
-
-### Converting a perfetto trace to systrace text format
-`./traceconv systrace [input proto file] [output systrace file]`
-
-### Opening a Perfetto trace in the legacy systrace UI
-Navigate to ui.perfetto.dev and choose the "Open with legacy UI" option. This
-runs traceconv (the progress of which can be seen in the UI) and passes the
-converted trace seamlessly to chrome://tracing
-
-### Converting a perfetto trace to Chrome JSON format (for chrome://tracing)
-`./traceconv json [input proto file] [output json file]`
diff --git a/protos/perfetto/trace/perfetto_trace.proto b/protos/perfetto/trace/perfetto_trace.proto
index 33444f5..7b82745 100644
--- a/protos/perfetto/trace/perfetto_trace.proto
+++ b/protos/perfetto/trace/perfetto_trace.proto
@@ -6838,8 +6838,24 @@

 // Begin of protos/perfetto/trace/trace_packet.proto

-// The root object emitted by Perfetto. A perfetto trace is just a stream of
-// TracePacket(s).
+// TracePacket is the root object of a Perfeto trace.
+// A Perfetto trace is a linear sequence of TracePacket(s).
+//
+// The tracing service guarantees that all TracePacket(s) written by a given
+// TraceWriter are seen in-order, without gaps or duplicates. If, for any
+// reason, a TraceWriter sequence becomes invalid, no more packets are returned
+// to the Consumer (or written into the trace file).
+// TracePacket(s) written by different TraceWriter(s), hence even different
+// data sources, can be seen in arbitrary order.
+// The consumer can re-establish a total order, if interested, using the packet
+// timestamps, after having synchronized the different clocks onto a global
+// clock.
+//
+// The tracing service is agnostic of the content of TracePacket, with the
+// exception of few fields (e.g.. trusted_*, trace_config) that are written by
+// the service itself.
+//
+// See the [Buffers and Dataflow](/docs/concepts/buffers.md) doc for details.
 //
 // Next reserved id: 13 (up to 15).
 // Next id: 71.
@@ -6860,7 +6876,6 @@
   optional uint32 timestamp_clock_id = 58;

   oneof data {
-    FtraceEventBundle ftrace_events = 1;
     ProcessTree process_tree = 2;
     ProcessStats process_stats = 9;
     InodeFileMap inode_file_map = 4;
@@ -6913,6 +6928,9 @@
     // Deprecated, use TrackDescriptor instead.
     ThreadDescriptor thread_descriptor = 44;

+    // Events from the Linux kernel ftrace infrastructure.
+    FtraceEventBundle ftrace_events = 1;
+
     // This field is emitted at periodic intervals (~10s) and
     // contains always the binary representation of the UUID
     // {82477a76-b28d-42ba-81dc-33326d57a079}. This is used to be able to
diff --git a/protos/perfetto/trace/trace_packet.proto b/protos/perfetto/trace/trace_packet.proto
index 993b05c..da02933 100644
--- a/protos/perfetto/trace/trace_packet.proto
+++ b/protos/perfetto/trace/trace_packet.proto
@@ -58,8 +58,24 @@

 package perfetto.protos;

-// The root object emitted by Perfetto. A perfetto trace is just a stream of
-// TracePacket(s).
+// TracePacket is the root object of a Perfeto trace.
+// A Perfetto trace is a linear sequence of TracePacket(s).
+//
+// The tracing service guarantees that all TracePacket(s) written by a given
+// TraceWriter are seen in-order, without gaps or duplicates. If, for any
+// reason, a TraceWriter sequence becomes invalid, no more packets are returned
+// to the Consumer (or written into the trace file).
+// TracePacket(s) written by different TraceWriter(s), hence even different
+// data sources, can be seen in arbitrary order.
+// The consumer can re-establish a total order, if interested, using the packet
+// timestamps, after having synchronized the different clocks onto a global
+// clock.
+//
+// The tracing service is agnostic of the content of TracePacket, with the
+// exception of few fields (e.g.. trusted_*, trace_config) that are written by
+// the service itself.
+//
+// See the [Buffers and Dataflow](/docs/concepts/buffers.md) doc for details.
 //
 // Next reserved id: 13 (up to 15).
 // Next id: 71.
@@ -80,7 +96,6 @@
   optional uint32 timestamp_clock_id = 58;

   oneof data {
-    FtraceEventBundle ftrace_events = 1;
     ProcessTree process_tree = 2;
     ProcessStats process_stats = 9;
     InodeFileMap inode_file_map = 4;
@@ -133,6 +148,9 @@
     // Deprecated, use TrackDescriptor instead.
     ThreadDescriptor thread_descriptor = 44;

+    // Events from the Linux kernel ftrace infrastructure.
+    FtraceEventBundle ftrace_events = 1;
+
     // This field is emitted at periodic intervals (~10s) and
     // contains always the binary representation of the UUID
     // {82477a76-b28d-42ba-81dc-33326d57a079}. This is used to be able to
diff --git a/src/protozero/README.md b/src/protozero/README.md
deleted file mode 100644
index 6b8311e..0000000
--- a/src/protozero/README.md
+++ /dev/null
@@ -1 +0,0 @@
-See [/docs/protozero.md](/docs/protozero.md)
diff --git a/src/trace_processor/rpc/README.md b/src/trace_processor/rpc/README.md
index 802be0e..edd66a1 100644
--- a/src/trace_processor/rpc/README.md
+++ b/src/trace_processor/rpc/README.md
@@ -5,7 +5,7 @@

 ## `wasm_bridge`

-The WASM (Web Asssembly) interop bridge. It's used to call the Trace Processor
+The WASM (Web Assembly) interop bridge. It's used to call the Trace Processor
 from HTML/JS using WASM's `ccall`.

 ## `httpd`
diff --git a/src/trace_processor/storage/stats.h b/src/trace_processor/storage/stats.h
index 1e6557e..c0aed2b 100644
--- a/src/trace_processor/storage/stats.h
+++ b/src/trace_processor/storage/stats.h
@@ -116,13 +116,21 @@
   F(heap_graph_malformed_packet,              kIndexed, kError,    kTrace),    \
   F(heap_graph_missing_packet,                kIndexed, kError,    kTrace),    \
   F(heap_graph_location_parse_error,          kSingle,  kError,    kTrace),    \
-  F(heapprofd_buffer_corrupted,               kIndexed, kError,    kTrace),    \
-  F(heapprofd_hit_guardrail,                  kIndexed, kError,    kTrace),    \
-  F(heapprofd_buffer_overran,                 kIndexed, kDataLoss, kTrace),    \
+  F(heapprofd_buffer_corrupted,               kIndexed, kError,    kTrace,     \
+      "Shared memory buffer corrupted. This is a bug or memory corruption "    \
+      "in the target. Indexed by target upid."),                               \
+  F(heapprofd_hit_guardrail,                  kIndexed, kError,    kTrace,     \
+      "HeapprofdConfig specified a CPU or Memory Guardrail that was hit. "     \
+      "Indexed by target upid."),                                              \
+  F(heapprofd_buffer_overran,                 kIndexed, kDataLoss, kTrace,     \
+      "The shared memory buffer between the target and heapprofd overran. "    \
+      "The profile was truncated early. Indexed by target upid."),             \
   F(heapprofd_client_disconnected,            kIndexed, kInfo,     kTrace),    \
   F(heapprofd_malformed_packet,               kIndexed, kError,    kTrace),    \
   F(heapprofd_missing_packet,                 kSingle,  kError,    kTrace),    \
-  F(heapprofd_rejected_concurrent,            kIndexed, kError,    kTrace),    \
+  F(heapprofd_rejected_concurrent,            kIndexed, kError,    kTrace,     \
+      "The target was already profiled by another tracing session, so the "    \
+      "profile was not taken. Indexed by target upid."),    \
   F(heapprofd_non_finalized_profile,          kSingle,  kError,    kTrace),    \
   F(metatrace_overruns,                       kSingle,  kError,    kTrace),    \
   F(packages_list_has_parse_errors,           kSingle,  kError,    kTrace),    \
diff --git a/src/trace_processor/tables/android_tables.h b/src/trace_processor/tables/android_tables.h
index 67a0eac..1686533 100644
--- a/src/trace_processor/tables/android_tables.h
+++ b/src/trace_processor/tables/android_tables.h
@@ -23,8 +23,17 @@
 namespace trace_processor {
 namespace tables {

-// Note: this table is not sorted by timestamp. This is why we omit the
+// Log entries from Android logcat.
+//
+// NOTE: this table is not sorted by timestamp. This is why we omit the
 // sorted flag on the ts column.
+//
+// @param ts timestamp of log entry.
+// @param utid thread writing the log entry {@joinable thread.utid}.
+// @param prio priority of the log. 3=DEBUG, 4=INFO, 5=WARN, 6=ERROR.
+// @param tag tag of the log entry.
+// @param msg content of the log entry.
+// @tablegroup Events
 #define PERFETTO_TP_ANDROID_LOG_TABLE_DEF(NAME, PARENT, C) \
   NAME(AndroidLogTable, "android_logs")                    \
   PERFETTO_TP_ROOT_TABLE(PARENT, C)                        \
diff --git a/src/trace_processor/tables/counter_tables.h b/src/trace_processor/tables/counter_tables.h
index a3cd5ab..4dd0be0 100644
--- a/src/trace_processor/tables/counter_tables.h
+++ b/src/trace_processor/tables/counter_tables.h
@@ -24,6 +24,8 @@
namespace trace_processor {
namespace tables {
+// @tablegroup Events
+// @param arg_set_id {@joinable args.arg_set_id}
#define PERFETTO_TP_COUNTER_TABLE_DEF(NAME, PARENT, C) \
NAME(CounterTable, "counter") \
PERFETTO_TP_ROOT_TABLE(PARENT, C) \
diff --git a/src/trace_processor/tables/macros_unittest.cc b/src/trace_processor/tables/macros_unittest.cc
index c53096c..b6b0269 100644
--- a/src/trace_processor/tables/macros_unittest.cc
+++ b/src/trace_processor/tables/macros_unittest.cc
@@ -22,6 +22,7 @@
namespace trace_processor {
namespace {
+// @param arg_set_id {@joinable args.arg_set_id}
#define PERFETTO_TP_TEST_EVENT_TABLE_DEF(NAME, PARENT, C) \
NAME(TestEventTable, "event") \
PARENT(PERFETTO_TP_ROOT_TABLE_PARENT_DEF, C) \
diff --git a/src/trace_processor/tables/metadata_tables.h b/src/trace_processor/tables/metadata_tables.h
index 4820640..fd0da3e 100644
--- a/src/trace_processor/tables/metadata_tables.h
+++ b/src/trace_processor/tables/metadata_tables.h
@@ -23,6 +23,7 @@
namespace trace_processor {
namespace tables {
+// @param arg_set_id {@joinable args.arg_set_id}
#define PERFETTO_TP_RAW_TABLE_DEF(NAME, PARENT, C) \
NAME(RawTable, "raw") \
PERFETTO_TP_ROOT_TABLE(PARENT, C) \
@@ -57,6 +58,12 @@
PERFETTO_TP_TABLE(PERFETTO_TP_METADATA_TABLE_DEF);
+// @name thread
+// @param utid {uint32_t} Unique thread id. This is != the OS tid. This is a
+// monotonic number associated to each thread. The OS thread id (tid)
+// cannot be used as primary key because tids and pids are recycled
+// by most kernels.
+// @param upid {@joinable process.upid}
#define PERFETTO_TP_THREAD_TABLE_DEF(NAME, PARENT, C) \
NAME(ThreadTable, "internal_thread") \
PERFETTO_TP_ROOT_TABLE(PARENT, C) \
@@ -68,6 +75,12 @@
PERFETTO_TP_TABLE(PERFETTO_TP_THREAD_TABLE_DEF);
+// @name process
+// @param upid {uint32_t} Unique process id. This is != the OS pid. This is a
+// monotonic number associated to each process. The OS process id (pid)
+// cannot be used as primary key because tids and pids are recycled by
+// most kernels.
+// @param uid The Unix user id of the process {@joinable package_list.uid}.
#define PERFETTO_TP_PROCESS_TABLE_DEF(NAME, PARENT, C) \
NAME(ProcessTable, "internal_process") \
PERFETTO_TP_ROOT_TABLE(PARENT, C) \
diff --git a/src/trace_processor/tables/profiler_tables.h b/src/trace_processor/tables/profiler_tables.h
index b5b51c7..2222a93 100644
--- a/src/trace_processor/tables/profiler_tables.h
+++ b/src/trace_processor/tables/profiler_tables.h
@@ -24,6 +24,16 @@
namespace trace_processor {
namespace tables {
+// The profiler smaps contains the memory stats for virtual memory ranges
+// captured by the [heap profiler](/docs/data-sources/native-heap-profiler.md).
+// @param upid The UniquePID of the process {@joinable process.upid}.
+// @param ts Timestamp of the snapshot. Multiple rows will have the same
+// timestamp.
+// @param path The mmaped file, as per /proc/pid/smaps.
+// @param size_kb Total size of the mapping.
+// @param private_dirty_kb KB of this mapping that are private dirty RSS.
+// @param swap_kb KB of this mapping that are in swap.
+// @tablegroup Callstack profilers
#define PERFETTO_TP_PROFILER_SMAPS_DEF(NAME, PARENT, C) \
NAME(ProfilerSmapsTable, "profiler_smaps") \
PERFETTO_TP_ROOT_TABLE(PARENT, C) \
@@ -36,6 +46,13 @@
PERFETTO_TP_TABLE(PERFETTO_TP_PROFILER_SMAPS_DEF);
+// Metadata about packages installed on the system.
+// This is generated by the packages_list data-source.
+// @param package_name name of the package, e.g. com.google.android.gm.
+// @param uid UID processes of this package run as.
+// @param debuggable bool whether this app is debuggable.
+// @param profileable_from_shell bool whether this app is profileable.
+// @param version_code versionCode from the APK.
#define PERFETTO_TP_PACKAGES_LIST_DEF(NAME, PARENT, C) \
NAME(PackageListTable, "package_list") \
PERFETTO_TP_ROOT_TABLE(PARENT, C) \
@@ -47,6 +64,13 @@
PERFETTO_TP_TABLE(PERFETTO_TP_PACKAGES_LIST_DEF);
+// A mapping (binary / library) in a process.
+// This is generated by the stack profilers: heapprofd and traced_perf.
+// @param build_id hex-encoded Build ID of the binary / library.
+// @param start start of the mapping in the process' address space.
+// @param end end of the mapping in the process' address space.
+// @param name filename of the binary / library {@joinable profiler_smaps.path}.
+// @tablegroup Callstack profilers
#define PERFETTO_TP_STACK_PROFILE_MAPPING_DEF(NAME, PARENT, C) \
NAME(StackProfileMappingTable, "stack_profile_mapping") \
PERFETTO_TP_ROOT_TABLE(PARENT, C) \
@@ -60,6 +84,15 @@
PERFETTO_TP_TABLE(PERFETTO_TP_STACK_PROFILE_MAPPING_DEF);
+// A frame on the callstack. This is a location in a program.
+// This is generated by the stack profilers: heapprofd and traced_perf.
+// @param name name of the function this location is in.
+// @param mapping the mapping (library / binary) this location is in.
+// @param rel_pc the program counter relative to the start of the mapping.
+// @param symbol_set_id if the profile was offline symbolized, the offline
+// symbol information of this frame.
+// {@joinable stack_profile_symbol.symbol_set_id}
+// @tablegroup Callstack profilers
#define PERFETTO_TP_STACK_PROFILE_FRAME_DEF(NAME, PARENT, C) \
NAME(StackProfileFrameTable, "stack_profile_frame") \
PERFETTO_TP_ROOT_TABLE(PARENT, C) \
@@ -70,6 +103,12 @@
PERFETTO_TP_TABLE(PERFETTO_TP_STACK_PROFILE_FRAME_DEF);
+// A callsite. This is a list of frames that were on the stack.
+// This is generated by the stack profilers: heapprofd and traced_perf.
+// @param depth distance from the bottom-most frame of the callstack.
+// @param parent_id parent frame on the callstack. NULL for the bottom-most.
+// @param frame_id frame at this position in the callstack.
+// @tablegroup Callstack profilers
#define PERFETTO_TP_STACK_PROFILE_CALLSITE_DEF(NAME, PARENT, C) \
NAME(StackProfileCallsiteTable, "stack_profile_callsite") \
PERFETTO_TP_ROOT_TABLE(PARENT, C) \
@@ -79,6 +118,11 @@
PERFETTO_TP_TABLE(PERFETTO_TP_STACK_PROFILE_CALLSITE_DEF);
+// This is generated by traced_perf.
+// @param ts timestamp this sample was taken at.
+// @param utid thread that was active when the sample was taken.
+// @param callsite_id callstack in active thread at time of sample.
+// @tablegroup Callstack profilers
#define PERFETTO_TP_CPU_PROFILE_STACK_SAMPLE_DEF(NAME, PARENT, C) \
NAME(CpuProfileStackSampleTable, "cpu_profile_stack_sample") \
PERFETTO_TP_ROOT_TABLE(PARENT, C) \
@@ -89,6 +133,26 @@
PERFETTO_TP_TABLE(PERFETTO_TP_CPU_PROFILE_STACK_SAMPLE_DEF);
+// Symbolization data for a frame. Rows with them same symbol_set_id describe
+// one frame, with the bottom-most inlined frame having id == symbol_set_id.
+//
+// For instance, if the function foo has an inlined call to the function bar,
+// which has an inlined call to baz, the stack_profile_symbol table would look
+// like this.
+//
+// ```
+// |id|symbol_set_id|name |source_file|line_number|
+// |--|-------------|-------------|-----------|-----------|
+// |1 | 1 |foo |foo.cc | 60 |
+// |2 | 1 |bar |foo.cc | 30 |
+// |3 | 1 |baz |foo.cc | 36 |
+// ```
+// @param name name of the function.
+// @param source_file name of the source file containing the function.
+// @param line_number line number of the frame in the source file. This is the
+// exact line for the corresponding program counter, not the beginning of the
+// function.
+// @tablegroup Callstack profilers
#define PERFETTO_TP_SYMBOL_DEF(NAME, PARENT, C) \
NAME(SymbolTable, "stack_profile_symbol") \
PERFETTO_TP_ROOT_TABLE(PARENT, C) \
@@ -99,6 +163,21 @@
PERFETTO_TP_TABLE(PERFETTO_TP_SYMBOL_DEF);
+// Allocations that happened at a callsite.
+// This is generated by heapprofd.
+// @param ts the timestamp the allocations happened at. heapprofd batches
+// allocations and frees, and all data from a dump will have the same
+// timestamp.
+// @param upid the UniquePID of the allocating process.
+// {@joinable process.upid}
+// @param callsite_id the callsite the allocation happened at.
+// @param count if positive: number of allocations that happened at this
+// callsite. if negative: number of allocations that happened at this callsite
+// that were freed.
+// @param size if positive: size of allocations that happened at this
+// callsite. if negative: size of allocations that happened at this callsite
+// that were freed.
+// @tablegroup Callstack profilers
#define PERFETTO_TP_HEAP_PROFILE_ALLOCATION_DEF(NAME, PARENT, C) \
NAME(HeapProfileAllocationTable, "heap_profile_allocation") \
PERFETTO_TP_ROOT_TABLE(PARENT, C) \
@@ -110,6 +189,11 @@
PERFETTO_TP_TABLE(PERFETTO_TP_HEAP_PROFILE_ALLOCATION_DEF);
+// Table used to render flamegraphs. This gives cumulative sizes of nodes in
+// the flamegraph.
+//
+// WARNING: This is experimental and the API is subject to change.
+// @tablegroup Callstack profilers
#define PERFETTO_TP_EXPERIMENTAL_FLAMEGRAPH_NODES(NAME, PARENT, C) \
NAME(ExperimentalFlamegraphNodesTable, "experimental_flamegraph_nodes") \
PERFETTO_TP_ROOT_TABLE(PARENT, C) \
@@ -132,6 +216,11 @@
PERFETTO_TP_TABLE(PERFETTO_TP_EXPERIMENTAL_FLAMEGRAPH_NODES);
+// @param name (potentially obfuscated) name of the class.
+// @param deobfuscated_name if class name was obfuscated and deobfuscation map
+// for it provided, the deobfuscated name.
+// @param location the APK / Dex / JAR file the class is contained in.
+// @tablegroup ART Heap Profiler
#define PERFETTO_TP_HEAP_GRAPH_CLASS_DEF(NAME, PARENT, C) \
NAME(HeapGraphClassTable, "heap_graph_class") \
PERFETTO_TP_ROOT_TABLE(PARENT, C) \
@@ -141,6 +230,23 @@
PERFETTO_TP_TABLE(PERFETTO_TP_HEAP_GRAPH_CLASS_DEF);
+// The objects on the Dalvik heap.
+//
+// All rows with the same (upid, graph_sample_ts) are one dump.
+// @param upid UniquePid of the target {@joinable process.upid}.
+// @param graph_sample_ts timestamp this dump was taken at.
+// @param object_id ARTs ID of the object. Either a pointer or a hashCode.
+// @param self_size size this object uses on the Java Heap.
+// @param retained_size DO NOT USE.
+// @param unique_retained_size DO NOT USE.
+// @param reference_set_id join key with heap_graph_reference containing all
+// objects referred in this object's fields.
+// {@joinable heap_graph_reference.reference_set_id}
+// @param reachable bool whether this object is reachable from a GC root. If
+// false, this object is uncollected garbage.
+// @param type_id class this object is an instance of.
+// @param root_type if not NULL, this object is a GC root.
+// @tablegroup ART Heap Profiler
#define PERFETTO_TP_HEAP_GRAPH_OBJECT_DEF(NAME, PARENT, C) \
NAME(HeapGraphObjectTable, "heap_graph_object") \
PERFETTO_TP_ROOT_TABLE(PARENT, C) \
@@ -157,6 +263,18 @@
PERFETTO_TP_TABLE(PERFETTO_TP_HEAP_GRAPH_OBJECT_DEF);
+// Many-to-many mapping between heap_graph_object.
+//
+// This associates the object with given reference_set_id with the objects
+// that are referred to by its fields.
+// @param reference_set_id join key to heap_graph_object.
+// @param owner_id id of object that has this reference_set_id.
+// @param owned_id id of object that is referred to.
+// @param field_name the field that refers to the object. E.g. Foo.name.
+// @param field_type_name the static type of the field. E.g. java.lang.String.
+// @param deobfuscated_field_name if field_name was obfuscated and a
+// deobfuscation mapping was provided for it, the deobfuscated name.
+// @tablegroup ART Heap Profiler
#define PERFETTO_TP_HEAP_GRAPH_REFERENCE_DEF(NAME, PARENT, C) \
NAME(HeapGraphReferenceTable, "heap_graph_reference") \
PERFETTO_TP_ROOT_TABLE(PARENT, C) \
@@ -169,6 +287,7 @@
PERFETTO_TP_TABLE(PERFETTO_TP_HEAP_GRAPH_REFERENCE_DEF);
+// @param arg_set_id {@joinable args.arg_set_id}
#define PERFETTO_TP_VULKAN_MEMORY_ALLOCATIONS_DEF(NAME, PARENT, C) \
NAME(VulkanMemoryAllocationsTable, "vulkan_memory_allocations") \
PERFETTO_TP_ROOT_TABLE(PARENT, C) \
diff --git a/src/trace_processor/tables/slice_tables.h b/src/trace_processor/tables/slice_tables.h
index 0500408..49eaaf1 100644
--- a/src/trace_processor/tables/slice_tables.h
+++ b/src/trace_processor/tables/slice_tables.h
@@ -24,6 +24,9 @@
namespace trace_processor {
namespace tables {
+// @name slice
+// @tablegroup Events
+// @param arg_set_id {@joinable args.arg_set_id}
#define PERFETTO_TP_SLICE_TABLE_DEF(NAME, PARENT, C) \
NAME(SliceTable, "internal_slice") \
PERFETTO_TP_ROOT_TABLE(PARENT, C) \
@@ -40,6 +43,8 @@
PERFETTO_TP_TABLE(PERFETTO_TP_SLICE_TABLE_DEF);
+// @tablegroup Events
+// @param arg_set_id {@joinable args.arg_set_id}
#define PERFETTO_TP_INSTANT_TABLE_DEF(NAME, PARENT, C) \
NAME(InstantTable, "instant") \
PERFETTO_TP_ROOT_TABLE(PARENT, C) \
@@ -51,6 +56,8 @@
PERFETTO_TP_TABLE(PERFETTO_TP_INSTANT_TABLE_DEF);
+// @tablegroup Events
+// @param utid {@joinable thread.utid}
#define PERFETTO_TP_SCHED_SLICE_TABLE_DEF(NAME, PARENT, C) \
NAME(SchedSliceTable, "sched_slice") \
PERFETTO_TP_ROOT_TABLE(PARENT, C) \
@@ -63,6 +70,7 @@
PERFETTO_TP_TABLE(PERFETTO_TP_SCHED_SLICE_TABLE_DEF);
+// @tablegroup Events
#define PERFETTO_TP_GPU_SLICES_DEF(NAME, PARENT, C) \
NAME(GpuSliceTable, "gpu_slice") \
PARENT(PERFETTO_TP_SLICE_TABLE_DEF, C) \
@@ -79,6 +87,7 @@
PERFETTO_TP_TABLE(PERFETTO_TP_GPU_SLICES_DEF);
+// @tablegroup Events
#define PERFETTO_TP_GRAPHICS_FRAME_SLICES_DEF(NAME, PARENT, C) \
NAME(GraphicsFrameSliceTable, "frame_slice") \
PARENT(PERFETTO_TP_SLICE_TABLE_DEF, C) \
@@ -89,6 +98,7 @@
// frame_slice -> frame_stats : 1 -> Many,
// with frame_slice.id = frame_stats.slice_id
+// @tablegroup Events
#define PERFETTO_TP_GRAPHICS_FRAME_STATS_DEF(NAME, PARENT, C) \
NAME(GraphicsFrameStatsTable, "frame_stats") \
PERFETTO_TP_ROOT_TABLE(PARENT, C) \
diff --git a/src/trace_processor/tables/track_tables.h b/src/trace_processor/tables/track_tables.h
index 29c3041..f9012d8 100644
--- a/src/trace_processor/tables/track_tables.h
+++ b/src/trace_processor/tables/track_tables.h
@@ -23,6 +23,8 @@
namespace trace_processor {
namespace tables {
+// @tablegroup Tracks
+// @param source_arg_set_id {@joinable args.arg_set_id}
#define PERFETTO_TP_TRACK_TABLE_DEF(NAME, PARENT, C) \
NAME(TrackTable, "track") \
PERFETTO_TP_ROOT_TABLE(PARENT, C) \
@@ -31,6 +33,7 @@
PERFETTO_TP_TABLE(PERFETTO_TP_TRACK_TABLE_DEF);
+// @tablegroup Tracks
#define PERFETTO_TP_PROCESS_TRACK_TABLE_DEF(NAME, PARENT, C) \
NAME(ProcessTrackTable, "process_track") \
PARENT(PERFETTO_TP_TRACK_TABLE_DEF, C) \
@@ -38,6 +41,7 @@
PERFETTO_TP_TABLE(PERFETTO_TP_PROCESS_TRACK_TABLE_DEF);
+// @tablegroup Tracks
#define PERFETTO_TP_THREAD_TRACK_TABLE_DEF(NAME, PARENT, C) \
NAME(ThreadTrackTable, "thread_track") \
PARENT(PERFETTO_TP_TRACK_TABLE_DEF, C) \
@@ -45,6 +49,7 @@
PERFETTO_TP_TABLE(PERFETTO_TP_THREAD_TRACK_TABLE_DEF);
+// @tablegroup Tracks
#define PERFETTO_TP_GPU_TRACK_DEF(NAME, PARENT, C) \
NAME(GpuTrackTable, "gpu_track") \
PARENT(PERFETTO_TP_TRACK_TABLE_DEF, C) \
@@ -54,6 +59,7 @@
PERFETTO_TP_TABLE(PERFETTO_TP_GPU_TRACK_DEF);
+// @tablegroup Tracks
#define PERFETTO_TP_COUNTER_TRACK_DEF(NAME, PARENT, C) \
NAME(CounterTrackTable, "counter_track") \
PARENT(PERFETTO_TP_TRACK_TABLE_DEF, C) \
@@ -62,6 +68,7 @@
PERFETTO_TP_TABLE(PERFETTO_TP_COUNTER_TRACK_DEF);
+// @tablegroup Tracks
#define PERFETTO_TP_THREAD_COUNTER_TRACK_DEF(NAME, PARENT, C) \
NAME(ThreadCounterTrackTable, "thread_counter_track") \
PARENT(PERFETTO_TP_COUNTER_TRACK_DEF, C) \
@@ -69,6 +76,7 @@
PERFETTO_TP_TABLE(PERFETTO_TP_THREAD_COUNTER_TRACK_DEF);
+// @tablegroup Tracks
#define PERFETTO_TP_PROCESS_COUNTER_TRACK_DEF(NAME, PARENT, C) \
NAME(ProcessCounterTrackTable, "process_counter_track") \
PARENT(PERFETTO_TP_COUNTER_TRACK_DEF, C) \
@@ -76,6 +84,7 @@
PERFETTO_TP_TABLE(PERFETTO_TP_PROCESS_COUNTER_TRACK_DEF);
+// @tablegroup Tracks
#define PERFETTO_TP_CPU_COUNTER_TRACK_DEF(NAME, PARENT, C) \
NAME(CpuCounterTrackTable, "cpu_counter_track") \
PARENT(PERFETTO_TP_COUNTER_TRACK_DEF, C) \
@@ -83,6 +92,7 @@
PERFETTO_TP_TABLE(PERFETTO_TP_CPU_COUNTER_TRACK_DEF);
+// @tablegroup Tracks
#define PERFETTO_TP_IRQ_COUNTER_TRACK_DEF(NAME, PARENT, C) \
NAME(IrqCounterTrackTable, "irq_counter_track") \
PARENT(PERFETTO_TP_COUNTER_TRACK_DEF, C) \
@@ -90,6 +100,7 @@
PERFETTO_TP_TABLE(PERFETTO_TP_IRQ_COUNTER_TRACK_DEF);
+// @tablegroup Tracks
#define PERFETTO_TP_SOFTIRQ_COUNTER_TRACK_DEF(NAME, PARENT, C) \
NAME(SoftirqCounterTrackTable, "softirq_counter_track") \
PARENT(PERFETTO_TP_COUNTER_TRACK_DEF, C) \
@@ -97,6 +108,7 @@
PERFETTO_TP_TABLE(PERFETTO_TP_SOFTIRQ_COUNTER_TRACK_DEF);
+// @tablegroup Tracks
#define PERFETTO_TP_GPU_COUNTER_TRACK_DEF(NAME, PARENT, C) \
NAME(GpuCounterTrackTable, "gpu_counter_track") \
PARENT(PERFETTO_TP_COUNTER_TRACK_DEF, C) \
diff --git a/src/tracing/README.md b/src/tracing/README.md
index 33134c0..10de62c 100644
--- a/src/tracing/README.md
+++ b/src/tracing/README.md
@@ -52,5 +52,5 @@
platform-specific things like implementation of shared memory and RPC mechanism.
`{include,src}/unix_rpc/`
-A concrete implementation of the transport layer based on unix domain sockets
+A concrete implementation of the transport layer based on UNIX domain sockets
and posix shared memory.