| # Perfetto UI |
| |
| [Perfetto UI](https://ui.perfetto.dev) enables you to view and analyze traces in |
| the browser. It supports several different tracing formats, including the |
| perfetto proto trace format and the legacy json trace format. |
| |
| ## New Features |
| What features have come to the UI recently? See below. |
| |
| ### Custom visualisation with Vega and Vega-lite |
| |
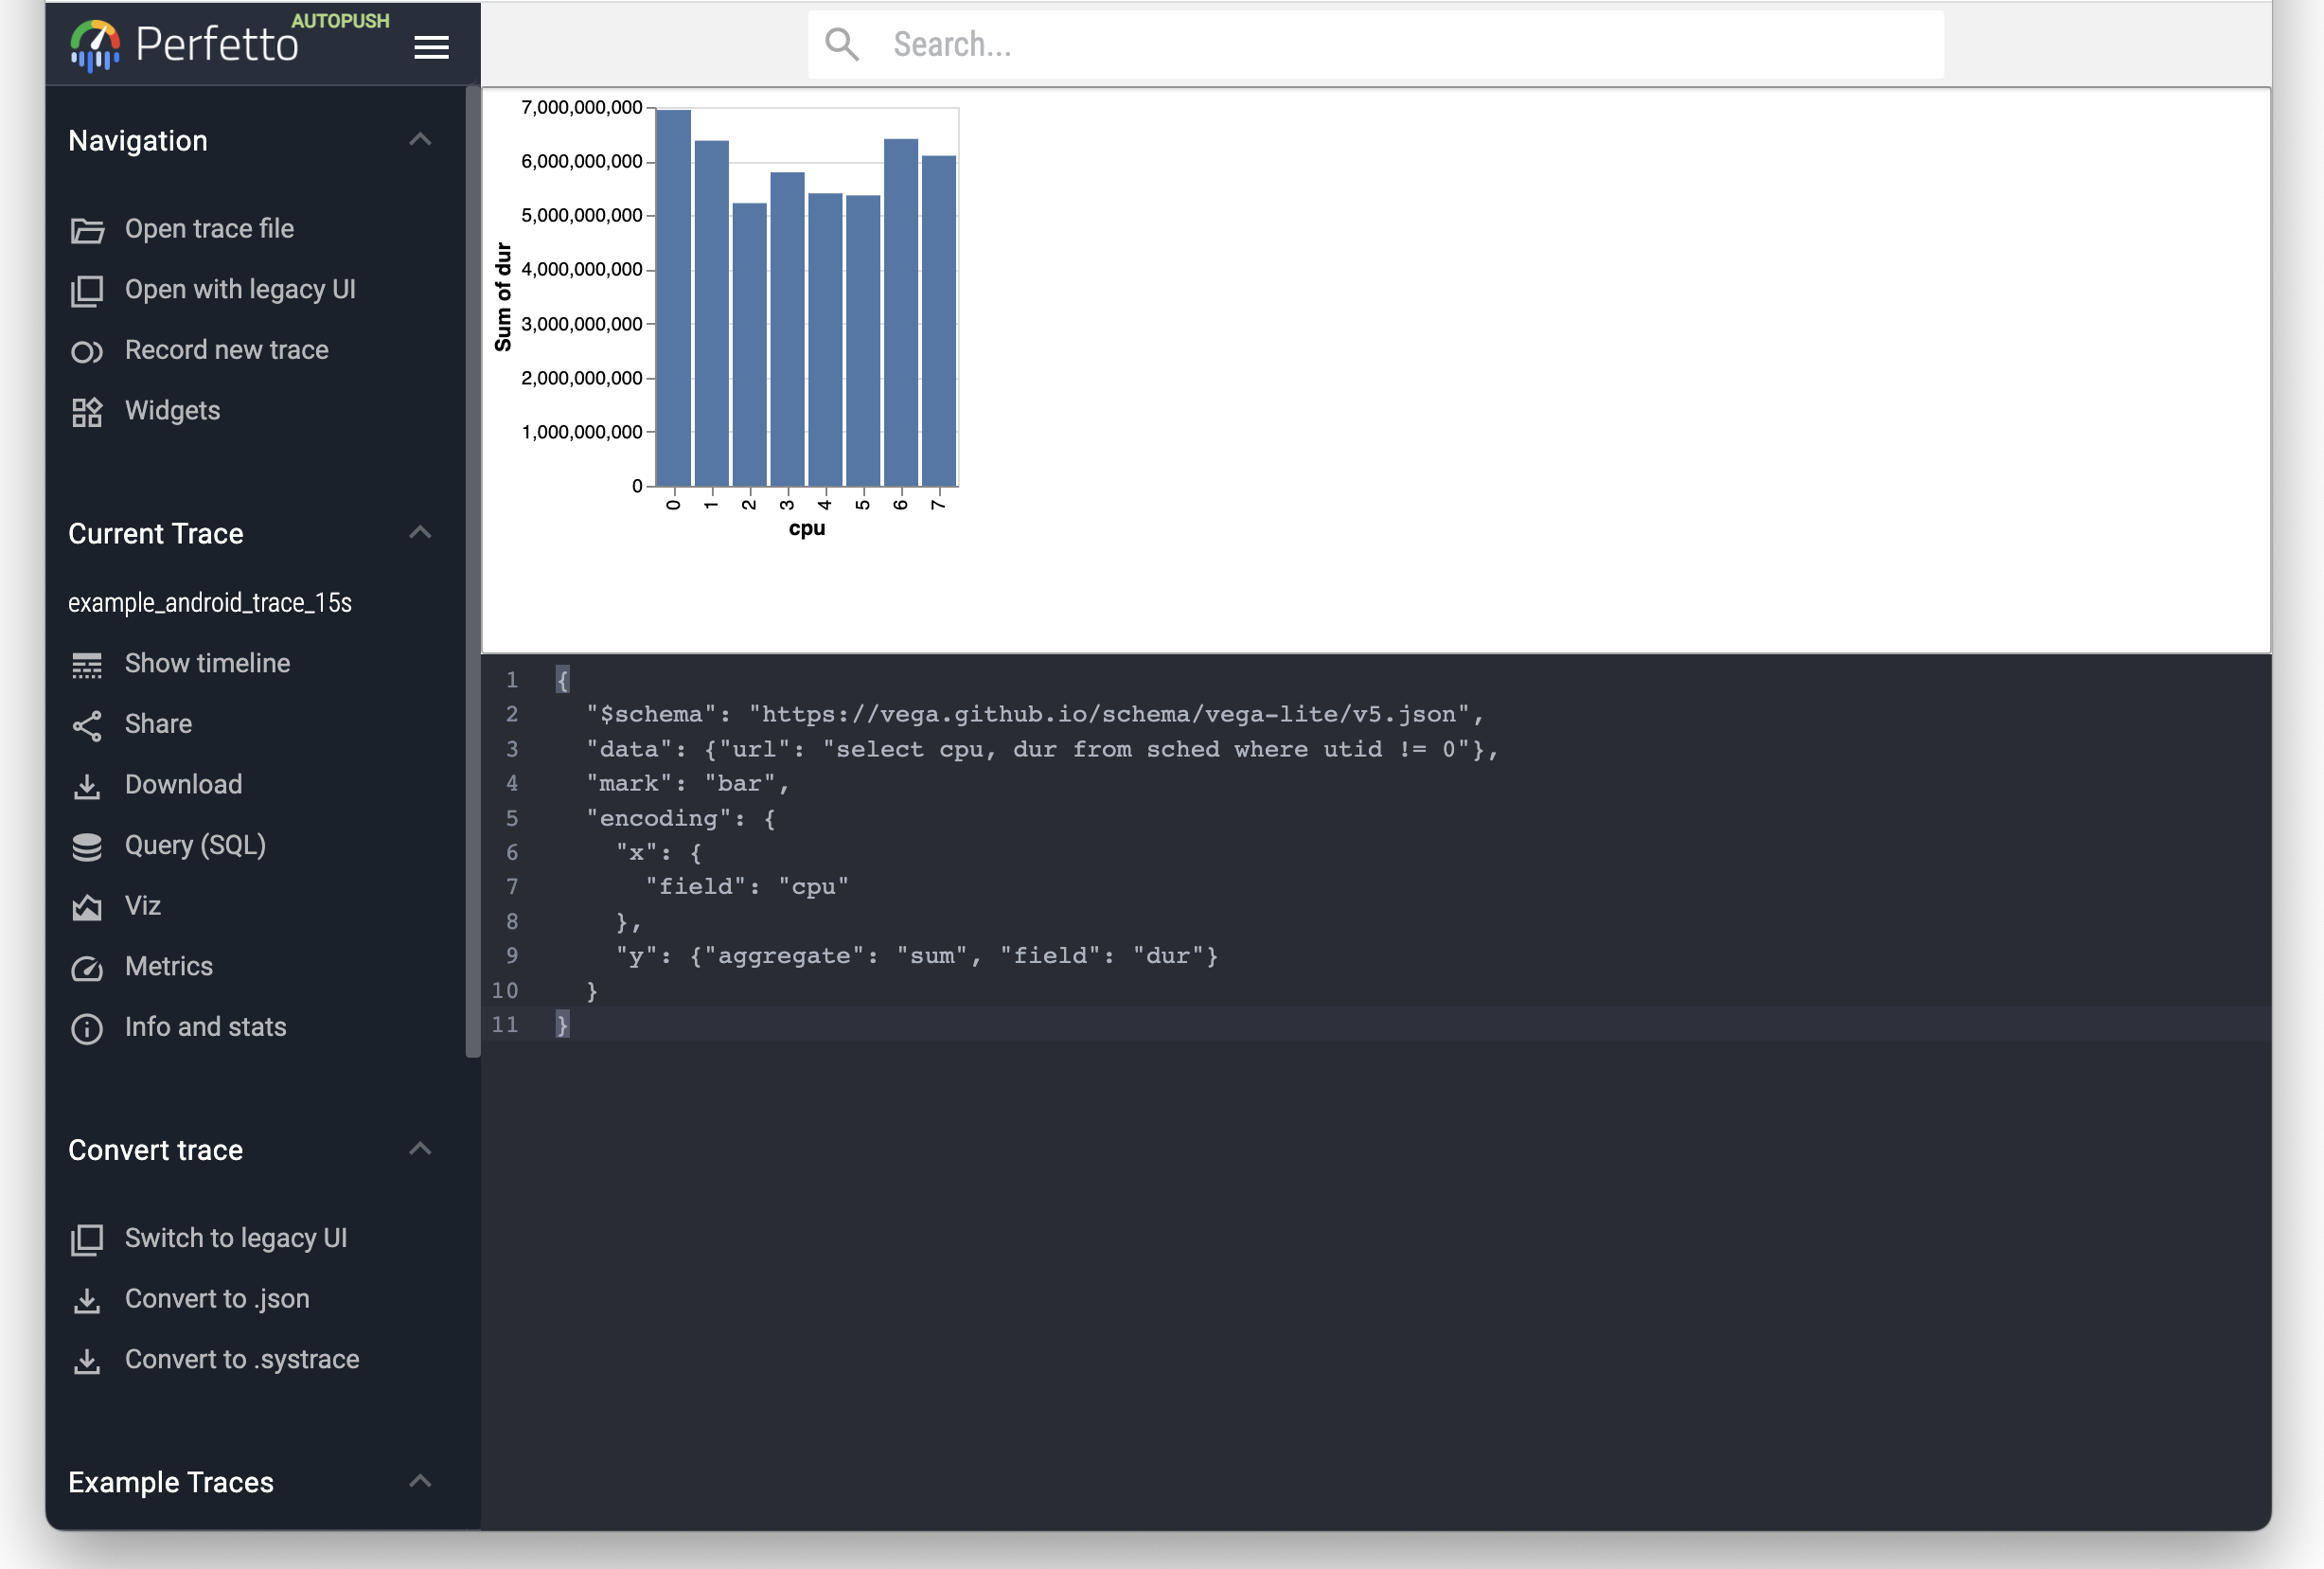
| The `Viz` page available in the sidebar after you load the trace allows |
| for custom visualisation using [Vega](https://vega.github.io/vega/) or |
| [Vega-lite](https://vega.github.io/vega-lite/docs/). |
| |
| Type a Vega specification into the bottom editor pane and the |
| visualisation will update in real time in the top pane. |
| You can put arbitrary `trace_processor` SQL queries where the URL would |
| go in a normal Vega visualisation. |
| |
|  |
| |
| Try the following visualisation with the Android example trace: |
| |
| ```json |
| { |
| "$schema": "https://vega.github.io/schema/vega-lite/v5.json", |
| "data": {"url": "select cpu, dur from sched where utid != 0"}, |
| "mark": "bar", |
| "encoding": { |
| "x": { |
| "field": "cpu" |
| }, |
| "y": {"aggregate": "sum", "field": "dur"} |
| } |
| } |
| ``` |
| |
| ### Command Palette |
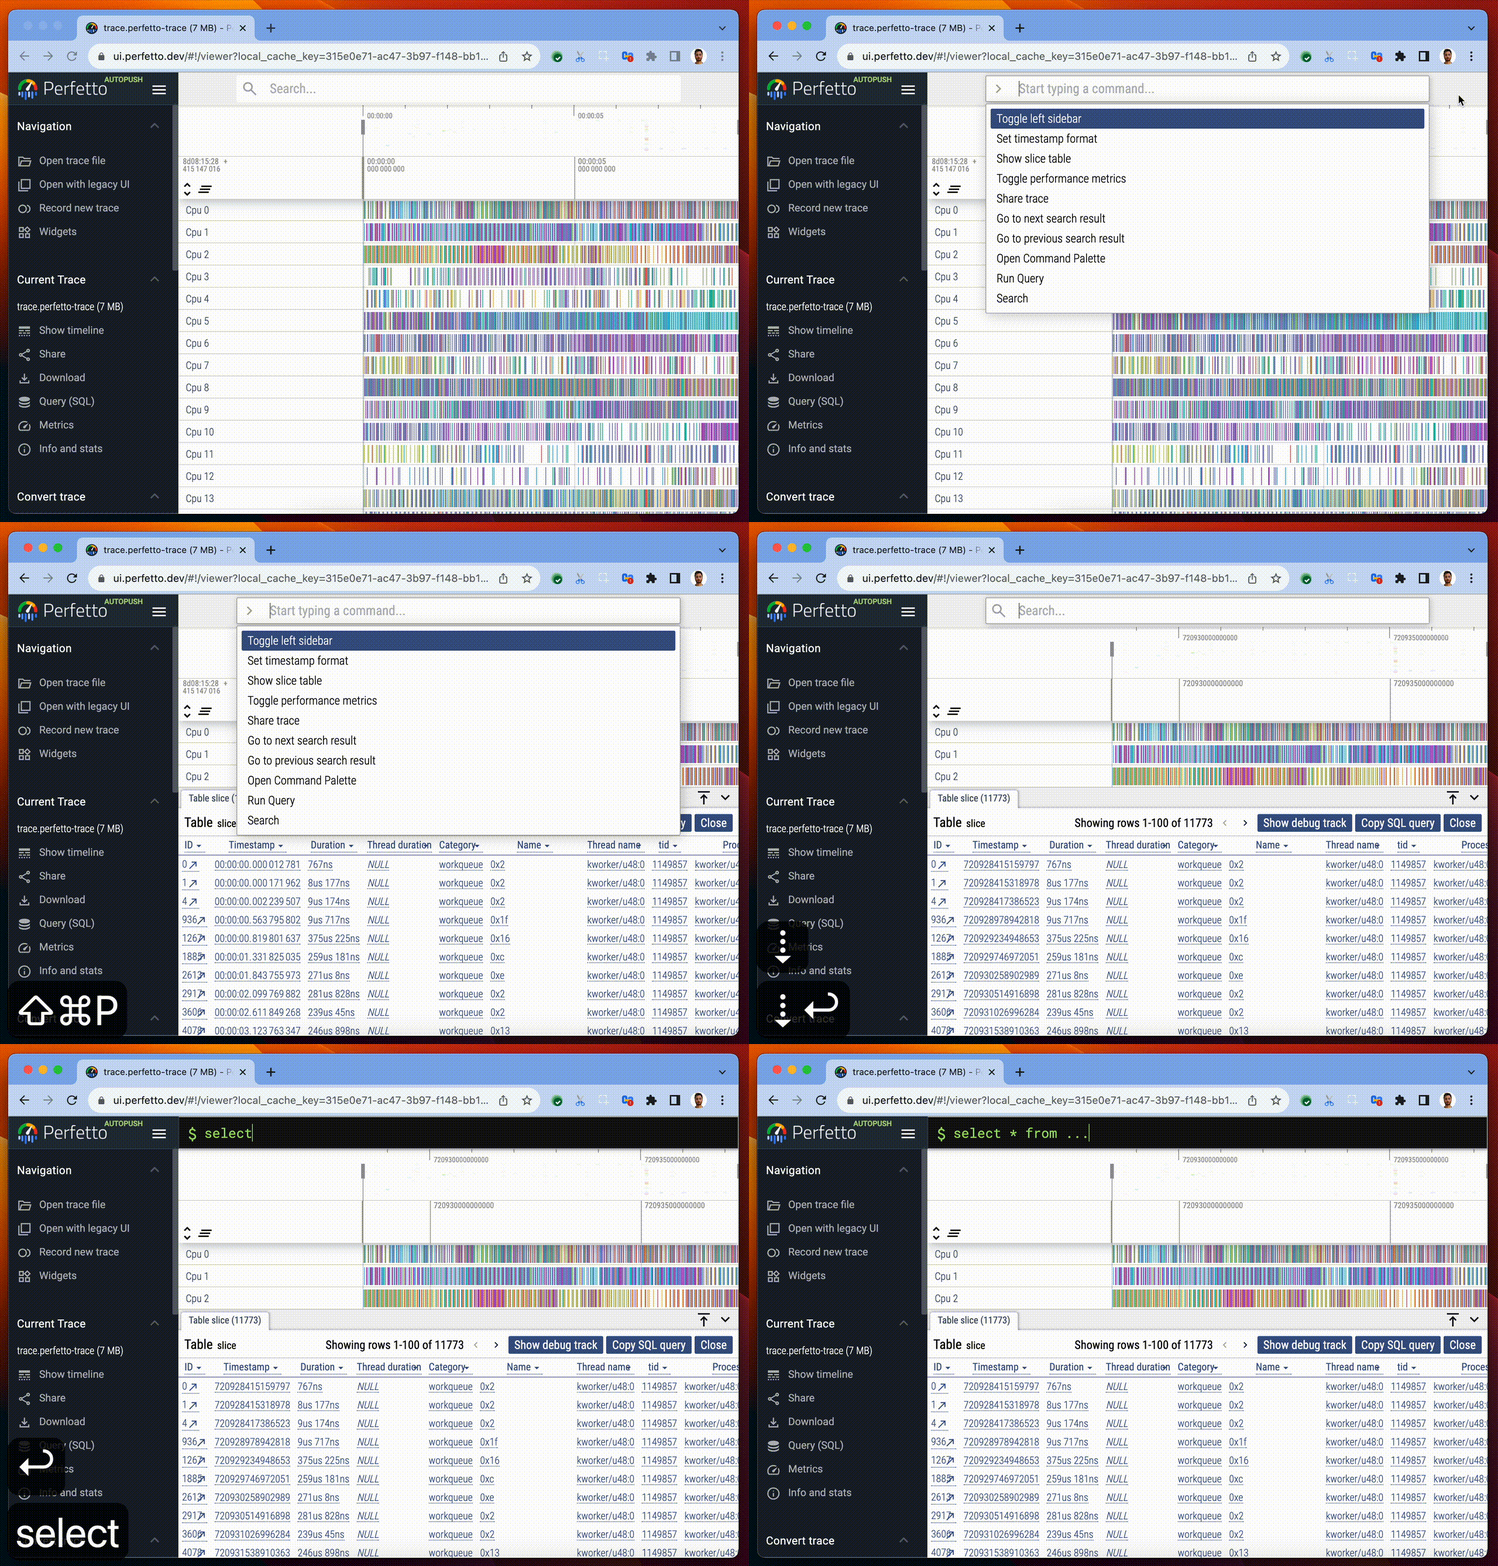
| Tired of remembering the location of buttons in the Perfetto UI? |
| Commands to the rescue! |
| |
|  |
| |
| Commands are: |
| - Discoverable & Searchable |
| - Keyboard driven |
| - Plugin-able |
| - Context sensitive |
| - ...with more added every day |
| |
| Access the command palette via `Ctrl-Shift-P` or by typing `>` in the |
| search bar. |
| |
| ### Changing the time format and offset |
| |
|  |
| |
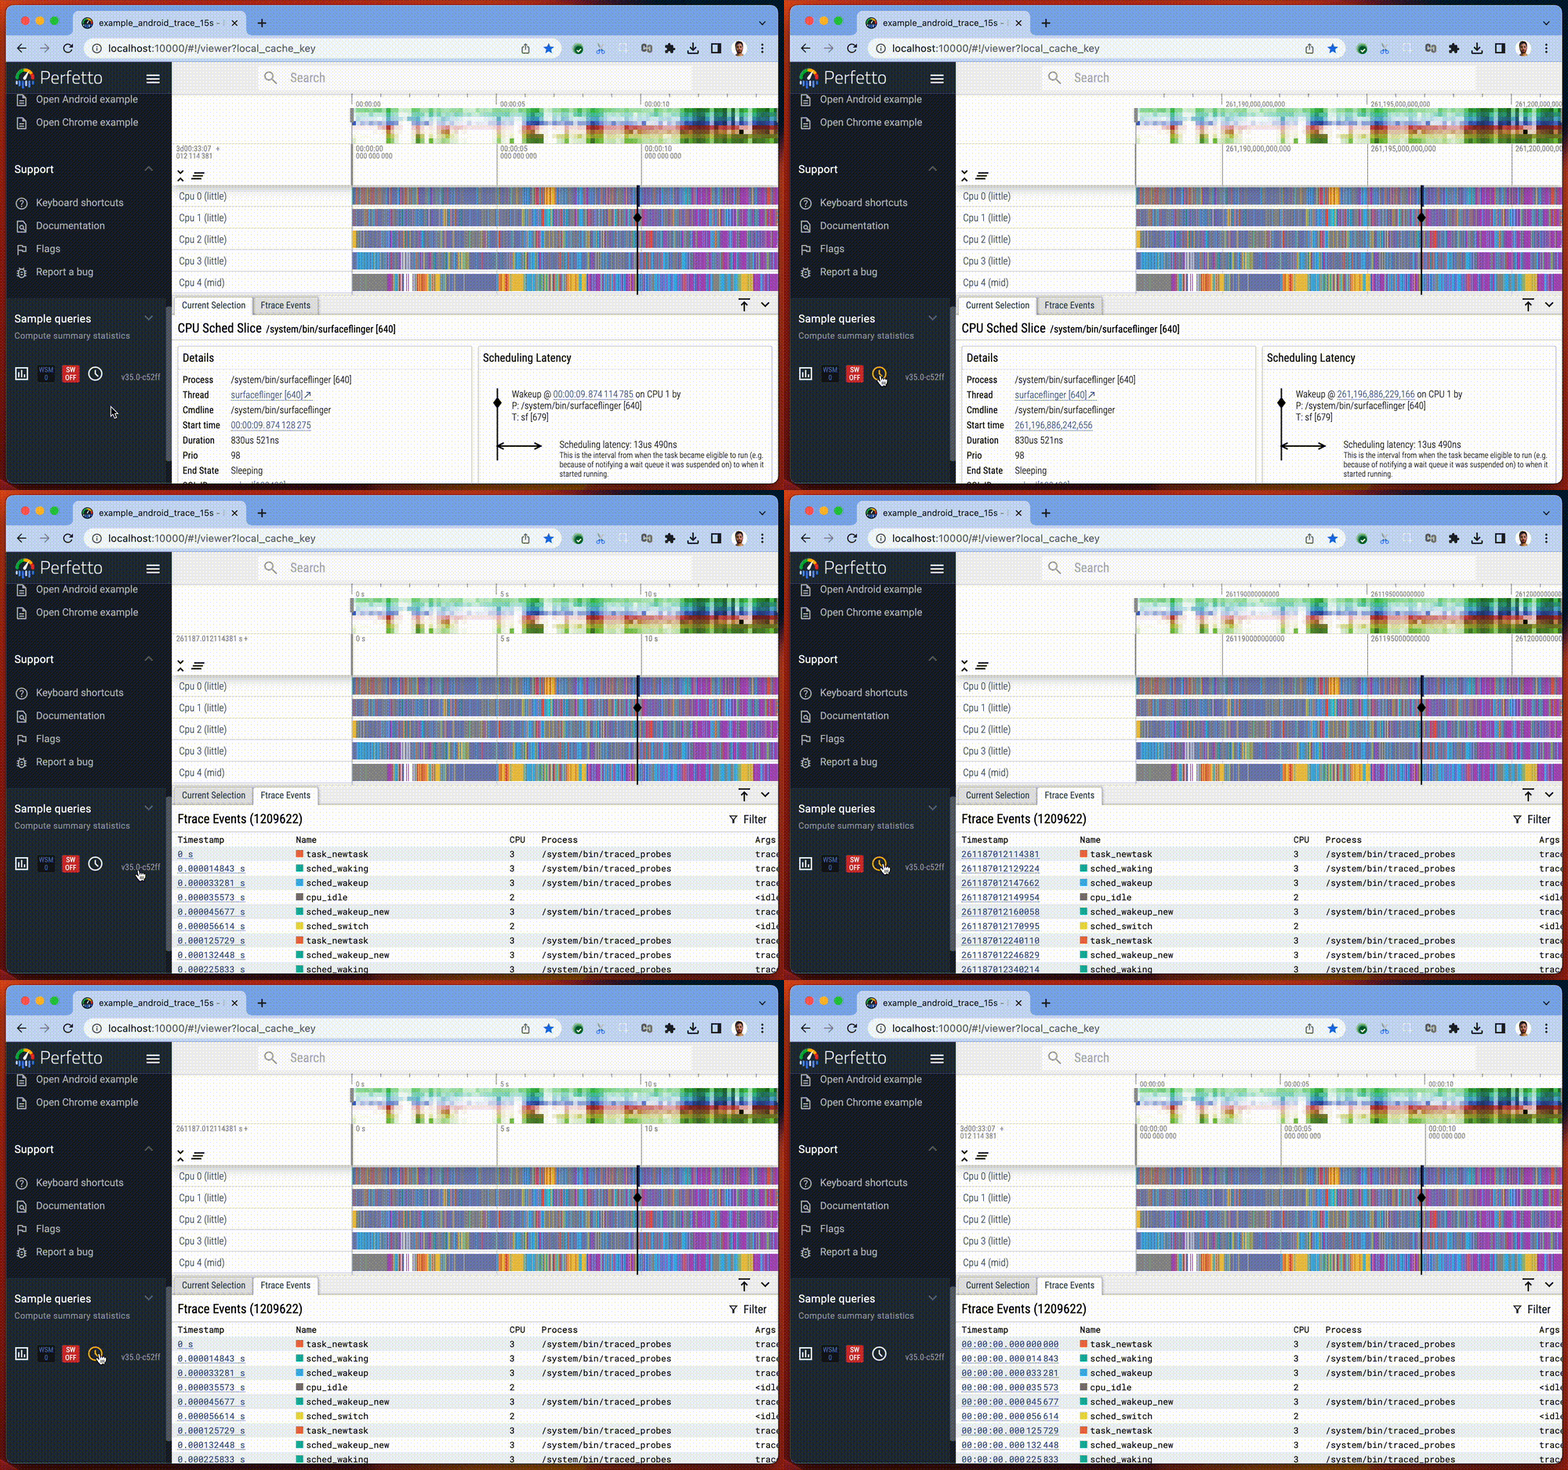
| The displayed timestamp format can be changed globally, cycling between seconds, raw nanoseconds and a new "timecode" format. |
| We also have a new `TO_TIMECODE()` function in Trace Processor to print timestamps in the timecode format. |
| |
| ## UI Tips and Tricks |
| |
| ### Pivot Tables |
| |
| To use pivot tables in the Perfetto UI, you will need to enable the |
| "Pivot tables" feature flag in the "Flags" tab under "Support" in the Sidebar. |
| You can pop up a pivot table over the entire trace when clicking "p" on your |
| keyboard. The "Edit" button opens a pop up window to add/remove and reorder |
| columns and change the default sorting of aggregations. |
| |
|  |
| |
| Clicking on "Query" generates a table with the selected columns. |
| Table cells with the expand icon can be expanded to show the next column values. |
| The "name (stack)" column displays top level slices that can be expanded to show |
| their descendants down to the last child. |
| |
|  |
| |
| Area selection pops up a pre-filled pivot table restricted over the selected |
| timestamps and track ids. |
| |
|  |
| |
| ### Disabling metrics |
| |
| Some metrics execute at trace load time to annotate the trace with |
| additional tracks and events. You can stop these metrics from |
| running by disabling them in the 'Flags' page: |
| |
|  |
| |
| |