

| # Instrumenting the Linux kernel with ftrace | |
| In this guide, you'll learn how to: | |
| - Instrument your kernel code using ftrace events. | |
| - Record ftrace events using `tracebox`. | |
| - Interpret ftrace events into tracks in `trace_processor`. | |
| - View the raw events and the interpreted tracks in the Perfetto UI. | |
| This guide is intended for **kernel and systems developers** who want to add | |
| custom instrumentation to the Linux kernel and integrate it with perfetto. | |
| People tinkering with a local kernel and wanting simple track visualisations | |
| without touching perfetto code can skim [Part C][section-c-link] instead. | |
| ## Introduction | |
| [Ftrace][ftrace-link] is a configurable tracing framework built into the Linux | |
| kernel. It allows developers to instrument the kernel with tracepoints and | |
| probes that can be dynamically enabled to record events at runtime (for example, | |
| a context switch from one thread to another on a given cpu). The userspace | |
| configures what to record, and reads the resulting traces via the `tracefs` | |
| filesystem, typically mounted at `/sys/kernel/tracing`. The kernel comes | |
| pre-instrumented with hundreds of tracepoints that can be used to understand | |
| scheduling, memory, and other subsystems. | |
| Perfetto can be [configured][cfg-link] to record a set of ftrace events as part | |
| of a perfetto trace. The system recording implementation (built into | |
| traced\_probes or tracebox) configures the tracefs and converts the resulting | |
| event stream into perfetto's protobuf trace format. | |
| The query engine and UI in turn have domain-specific parsing of ftrace events. | |
| For example raw context switch and wakeup events are turned into per-cpu and | |
| per-thread scheduling tracks in the UI, backed by queryable SQL tables. | |
| TIP: if you simply want to visualise the execution of kernel functions, perfetto | |
| has built-in visualisation for the `function_graph` tracer built into ftrace, | |
| which does not require any additional instrumentation. See the | |
| [function graph data source](/docs/data-sources/funcgraph.md) page (or [these | |
| config options][funcgraph-cfg-link]) for more details. | |
| This page is split into three sections: | |
| - [Part A][section-a-link]: covers creating an example kernel module with a | |
| static tracepoint, recording the events with perfetto, and viewing the basic | |
| event data in the perfetto UI. | |
| - [Part B][section-b-link] (advanced): covers adding dedicated parsing for the | |
| tracepoint by modifying perfetto sources. This lets you take full | |
| advantage of turning your events into structured SQL tables and UI tracks. | |
| - [Part C][section-c-link]: as an alternative to the above, describes a | |
| convention for structuring tracepoints so that perfetto can automatically turn | |
| them into slices/instants/counters **without modifying perfetto sources**. | |
| [funcgraph-cfg-link]: https://source.chromium.org/chromium/chromium/src/+/main:third_party/perfetto/protos/perfetto/config/ftrace/ftrace_config.proto?q=enable_function_graph | |
| [ftrace-link]: https://www.kernel.org/doc/html/latest/trace/ftrace.html | |
| [cfg-link]: https://source.chromium.org/chromium/chromium/src/+/main:third_party/perfetto/protos/perfetto/config/ftrace/ftrace_config.proto?q=FtraceConfig | |
| [section-a-link]: #part-a-instrumenting-the-kernel-and-recording-tracepoints | |
| [section-b-link]: #part-b-integrating-new-tracepoints-with-perfetto | |
| [section-c-link]: #part-c-simple-slice-counter-visualisations-without-modifying-perfetto-code-kernel-track-events- | |
| ## Part A: Instrumenting the kernel and recording tracepoints | |
| ### Create the kernel module source files | |
| For this example we are going to create a kernel module called `ticker` which | |
| contains a tracepoint called `ticker_tick` which is called every second with an | |
| incrementing counter as the argument. | |
| Create a new directory and copy the following file contents into the following | |
| directory structure: | |
| ``` | |
| . | |
| ├── Makefile | |
| ├── ticker.c | |
| └── trace | |
| └── events | |
| └── ticker.h | |
| ``` | |
| The main source: | |
| ```c | |
| // ticker.c | |
| #include <linux/kernel.h> | |
| #include <linux/module.h> | |
| #include <linux/timer.h> | |
| #include <linux/version.h> | |
| #define CREATE_TRACE_POINTS | |
| #include "trace/events/ticker.h" | |
| MODULE_LICENSE("GPL"); | |
| MODULE_AUTHOR("Perfetto"); | |
| MODULE_DESCRIPTION("Ticker: A kernel module emitting example static tracepoint events."); | |
| MODULE_VERSION("0.1"); | |
| static struct timer_list my_timer; | |
| static unsigned int tick_count = 0; | |
| static unsigned long timer_interval_ms = 1000; | |
| static void my_timer_callback(struct timer_list *timer) | |
| { | |
| // Fire the tracepoint, incrementing the tick count every time. | |
| // The function name is trace_<event_name> from the header file. | |
| trace_ticker_tick(tick_count++); | |
| // Re-arm the timer. | |
| mod_timer(&my_timer, jiffies + msecs_to_jiffies(timer_interval_ms)); | |
| } | |
| static int __init ticker_init(void) | |
| { | |
| pr_info("Ticker: Initializing...\n"); | |
| timer_setup(&my_timer, my_timer_callback, 0); | |
| mod_timer(&my_timer, jiffies + msecs_to_jiffies(timer_interval_ms)); | |
| pr_info("Ticker: Timer started.\n"); | |
| pr_info("Ticker: View events under /sys/kernel/tracing/events/ticker/\n"); | |
| return 0; | |
| } | |
| static void __exit ticker_exit(void) | |
| { | |
| pr_info("Ticker: Exiting...\n"); | |
| #if LINUX_VERSION_CODE >= KERNEL_VERSION(6, 15, 0) | |
| timer_delete_sync(&my_timer); | |
| #else | |
| del_timer_sync(&my_timer); | |
| #endif | |
| pr_info("Ticker: Timer stopped and module unloaded.\n"); | |
| } | |
| module_init(ticker_init); | |
| module_exit(ticker_exit); | |
| ``` | |
| The header defining the tracepoints. Note that it is important for the header to | |
| be under `trace/events/` and not at the root of the directory. Otherwise the | |
| kernel macros won't expand correctly: | |
| ```h | |
| // trace/events/ticker.h | |
| #undef TRACE_SYSTEM | |
| #define TRACE_SYSTEM ticker | |
| #if !defined(_TRACE_TICKER_H_) || defined(TRACE_HEADER_MULTI_READ) | |
| #define _TRACE_TICKER_H_ | |
| #include <linux/tracepoint.h> | |
| TRACE_EVENT(ticker_tick, | |
| TP_PROTO(unsigned int count), | |
| TP_ARGS(count), | |
| TP_STRUCT__entry( | |
| __field(unsigned int, count) | |
| ), | |
| TP_fast_assign( | |
| __entry->count = count; | |
| ), | |
| TP_printk("count=%u", | |
| __entry->count | |
| ) | |
| ); | |
| #endif /* _TRACE_TICKER_H_ */ | |
| /* This part must be outside protection */ | |
| #include <trace/define_trace.h> | |
| ``` | |
| Finally, the makefile for building the module: | |
| ```makefile | |
| # Makefile | |
| obj-m += ticker.o | |
| ccflags-y += -I$(src) | |
| KDIR ?= /lib/modules/$(shell uname -r)/build | |
| PWD := $(shell pwd) | |
| all: | |
| $(MAKE) -C $(KDIR) M=$(PWD) modules | |
| clean: | |
| $(MAKE) -C $(KDIR) M=$(PWD) clean | |
| .PHONY: all clean | |
| ``` | |
| ### Build and load the module | |
| Make sure your kernel headers are installed and run `make` to build the kernel | |
| module. | |
| You can now install the kernel module with: | |
| ```bash | |
| sudo insmod ticker.ko | |
| ``` | |
| Note: You can always uninstall the kernel module with: | |
| ```bash | |
| sudo rmmod ticker.ko | |
| ``` | |
| ### (optional) Manually verify the tracepoint | |
| We can manually verify the tracepoint by using the `tracefs` file system to view | |
| the textual representation of the event. | |
| First, confirm that the event is present in tracefs: | |
| ```bash | |
| ls /sys/kernel/tracing/events/ticker/ticker_tick | |
| ``` | |
| Enable our ticker event and tracing in general: | |
| ```bash | |
| echo 1 | sudo tee /sys/kernel/tracing/events/ticker/ticker_tick/enable | |
| echo 1 | sudo tee /sys/kernel/tracing/tracing_on | |
| ``` | |
| Listen to the stream of ftrace events with: | |
| ```bash | |
| sudo cat /sys/kernel/tracing/trace_pipe | |
| ``` | |
| You should see the ticker events being emitted roughly every second, with an | |
| incrementing "count" field. The textual event representation is printed using | |
| the `TP_printk(...)` part of the tracepoint definition above. | |
| ``` | |
| # cat /sys/kernel/tracing/trace_pipe | |
| <idle>-0 [011] ..s1. 850584.176058: ticker_tick: count=38 | |
| <idle>-0 [011] ..s1. 850585.200042: ticker_tick: count=39 | |
| <...>-2904431 [015] ..s1. 850586.224031: ticker_tick: count=40 | |
| puppet-2904431 [015] ..s.. 850587.248080: ticker_tick: count=41 | |
| <idle>-0 [011] ..s1. 850588.272137: ticker_tick: count=42 | |
| <idle>-0 [011] ..s1. 850589.296040: ticker_tick: count=43 | |
| <idle>-0 [011] ..s1. 850590.320049: ticker_tick: count=44 | |
| <idle>-0 [011] ..s1. 850591.344048: ticker_tick: count=45 | |
| <idle>-0 [011] ..s1. 850592.372038: ticker_tick: count=46 | |
| <idle>-0 [011] ..s1. 850593.392033: ticker_tick: count=47 | |
| <idle>-0 [003] ..s1. 850594.416049: ticker_tick: count=48 | |
| <idle>-0 [011] ..s1. 850595.440054: ticker_tick: count=49 | |
| ``` | |
| ### Record a perfetto trace with tracebox | |
| In order to record our ticker events, we are going to record a system trace | |
| using `tracebox`. First we need to create a recording config file that's | |
| configured to do so: | |
| ``` | |
| # ticker.cfg | |
| buffers { | |
| size_kb: 20480 | |
| fill_policy: DISCARD | |
| } | |
| # Record our ticker events only. | |
| data_sources { | |
| config { | |
| name: "linux.ftrace" | |
| target_buffer: 0 | |
| ftrace_config { | |
| ftrace_events: "ticker/ticker_tick" | |
| } | |
| } | |
| } | |
| # 10s trace, but can be stopped prematurely. | |
| duration_ms: 10000 | |
| ``` | |
| See the [system tracing page](/docs/getting-started/system-tracing.md) in order | |
| to get set up with tracebox. For this example we are going to record a trace | |
| from the command line using the config file we just created: | |
| ```bash | |
| ./tracebox -c ticker.cfg --txt -o ticker.pftrace | |
| ``` | |
| Note: tracebox will take care of enabling tracing and our ticker events (as we | |
| did manually in the preceding step). | |
| This will write a perfetto protobuf trace to `ticker.pftrace`. | |
| ### View the perfetto trace in the UI | |
| We can now explore the recorded trace in the perfetto UI. Navigate to | |
| https://ui.perfetto.dev and drag-n-drop your file into the window (or press | |
| `Ctrl+O` to bring up the open file dialog). | |
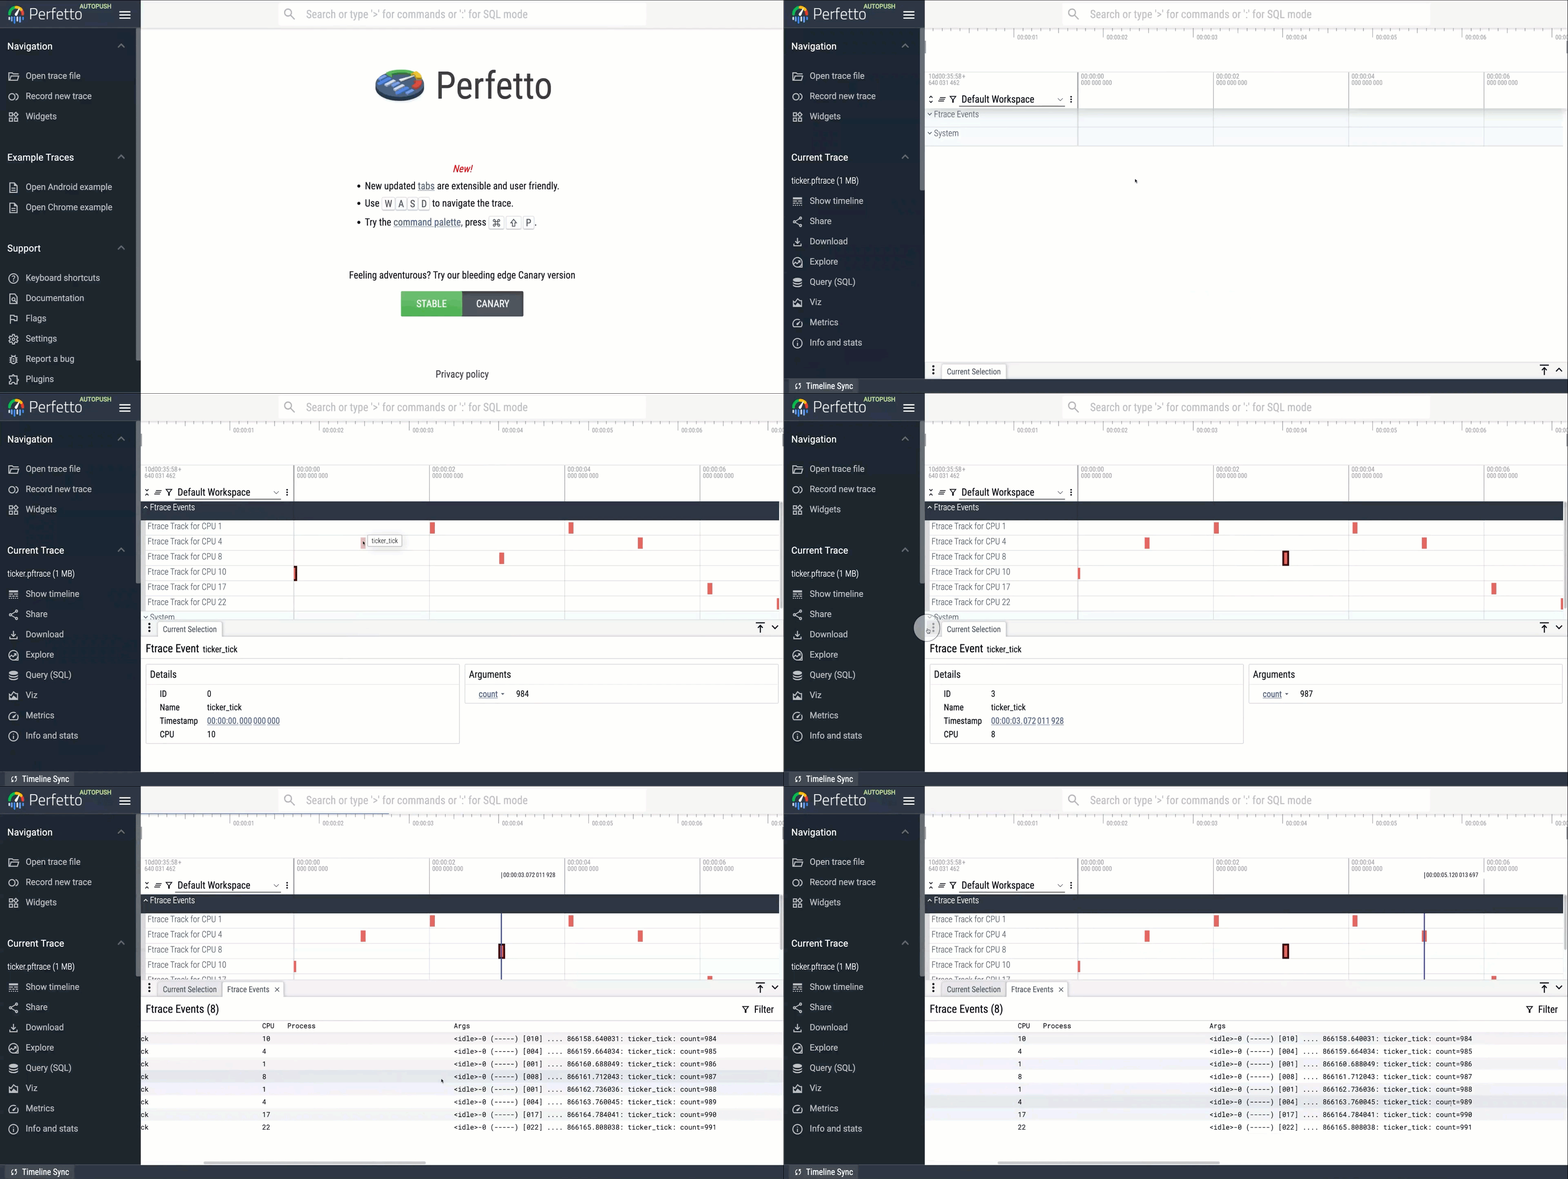
| Expand the "Ftrace Events" track group for a per-cpu view of events, which can | |
| be selected to show their fields. Additionally, `Ctrl+shift+P -> "Show ftrace | |
| tab"` opens up a tab with an approximation of the textual output. However note | |
| that because perfetto records the binary representation of events, it does not | |
| textualise the events according to the `TP_printk(..)` specifier. | |
|  | |
| The events can also be queried with a query like: | |
| ```sql | |
| SELECT * FROM ftrace_event JOIN args USING (arg_set_id) | |
| ``` | |
| ## Part B: Integrating new tracepoints with perfetto | |
| To add dedicated parsing for this new tracepoint in Perfetto, we need to: | |
| - generate a protobuf description of the event, so that the serialising code (in | |
| traced\_probes or tracebox) can write the events as that protobuf type, | |
| instead of a generic fallback encoding that was implicitly used above. | |
| - add a decoder to trace\_processor (the query engine) that creates the desired | |
| tracks out of the new events when parsing the protobuf trace. | |
| As an example, we'll parse the ticker event into a global counter track. | |
| (We'll be modifying perfetto sources so clone the repository if you have not | |
| already done so. The rest of the instructions assume that your current directory | |
| is the repository's root.) | |
| ### Generate the protobuf event description in perfetto | |
| First, copy the "format" file that describes the event in the tracefs filesystem | |
| to perfetto: | |
| ```sh | |
| DEST=src/traced/probes/ftrace/test/data/synthetic/events/ticker/ticker_tick; \ | |
| mkdir -p $DEST && \ | |
| cp /sys/kernel/tracing/events/ticker/ticker_tick/format $DEST/format | |
| ``` | |
| Then add the event to the following list: | |
| ```sh | |
| echo "ticker/ticker_tick" >> src/tools/ftrace_proto_gen/event_list | |
| ``` | |
| Then run the generator scripts to create the protobuf description and | |
| other compile-time files for both the serialising and decoding code: | |
| ```sh | |
| tools/run_ftrace_proto_gen | |
| tools/gen_all out/YOUR_BUILD_DIRECTORY | |
| ``` | |
| This should create/modify at least the following files: | |
| `protos/perfetto/trace/ftrace/ftrace_event.proto`, | |
| `protos/perfetto/trace/ftrace/ticker.proto`, | |
| `src/traced/probes/ftrace/event_info.cc`, | |
| `protos/perfetto/trace/perfetto_trace.proto`. | |
| This is sufficient for the serialising logic to start using the dedicated | |
| protobuf type for your events. Note: when recording, perfetto reads the event's | |
| format file in tracefs at runtime, and serialises only the fields that were | |
| known at perfetto's compile time. | |
| Rebuild `tracebox` locally with your changes and re-record the trace. | |
| ### Parse the event in trace\_processor | |
| Now we can add the decoding and parsing logic for the protobufs to the | |
| [ftrace\_parser.cc][ftrace-parser-link] in the trace\_processor. | |
| As an example, to create a single global counter track for all events: | |
| - add a case to the large `ParseFtraceEvent` switch-case. | |
| - add a function that interns a track and attaches all of the timestamped values | |
| as counts. | |
| Example additions (omitting the header change): | |
| ```c++ | |
| // ftrace_parser.cc | |
| static constexpr auto kTickerCountBlueprint = tracks::CounterBlueprint( | |
| "ticker", | |
| tracks::UnknownUnitBlueprint(), | |
| tracks::DimensionBlueprints(), | |
| tracks::StaticNameBlueprint("Ticker")); | |
| // ~~ snip ~~ | |
| case FtraceEvent::kTickerTickFieldNumber: { | |
| ParseTickerEvent(cpu, ts, fld_bytes); | |
| break; | |
| } | |
| // ~~ snip ~~ | |
| void FtraceParser::ParseTickerEvent(uint32_t cpu, | |
| int64_t timestamp, | |
| protozero::ConstBytes data) { | |
| protos::pbzero::TickerTickFtraceEvent::Decoder ticker_event(data); | |
| PERFETTO_LOG("Parsing ticker event: %" PRId64 ", %" PRIu32 ", %d", | |
| timestamp, | |
| cpu, | |
| static_cast<int>(ticker_event.count())); | |
| // Push the global counter. | |
| TrackId track = context_->track_tracker->InternTrack(kTickerCountBlueprint); | |
| context_->event_tracker->PushCounter( | |
| timestamp, static_cast<double>(ticker_event.count()), track); | |
| } | |
| ``` | |
| After rebuilding the `trace_processor` (or the whole UI), the data can be | |
| queried from the counter table: | |
| ``` | |
| SELECT * | |
| FROM counter | |
| JOIN counter_track ct ON ct.id = counter.track_id | |
| WHERE ct.type = 'ticker' | |
| ``` | |
| ### Visualise the track in the UI | |
| In order to actually see this track in the UI it needs to be added by some UI | |
| code (organised in perfetto as plugins). We'll use the simplest option, | |
| `dev.perfetto.TraceProcessorTrack`. Make the following edit to add all counter | |
| tracks of type "ticker" to the `SYSTEM` top level group: | |
| ```ts | |
| // ui/src/plugins/dev.perfetto.TraceProcessorTrack/counter_tracks.ts | |
| ~~ snip ~~ | |
| { | |
| type: 'ticker', | |
| topLevelGroup: 'SYSTEM', | |
| group: undefined, | |
| }, | |
| ~~ snip ~~ | |
| ``` | |
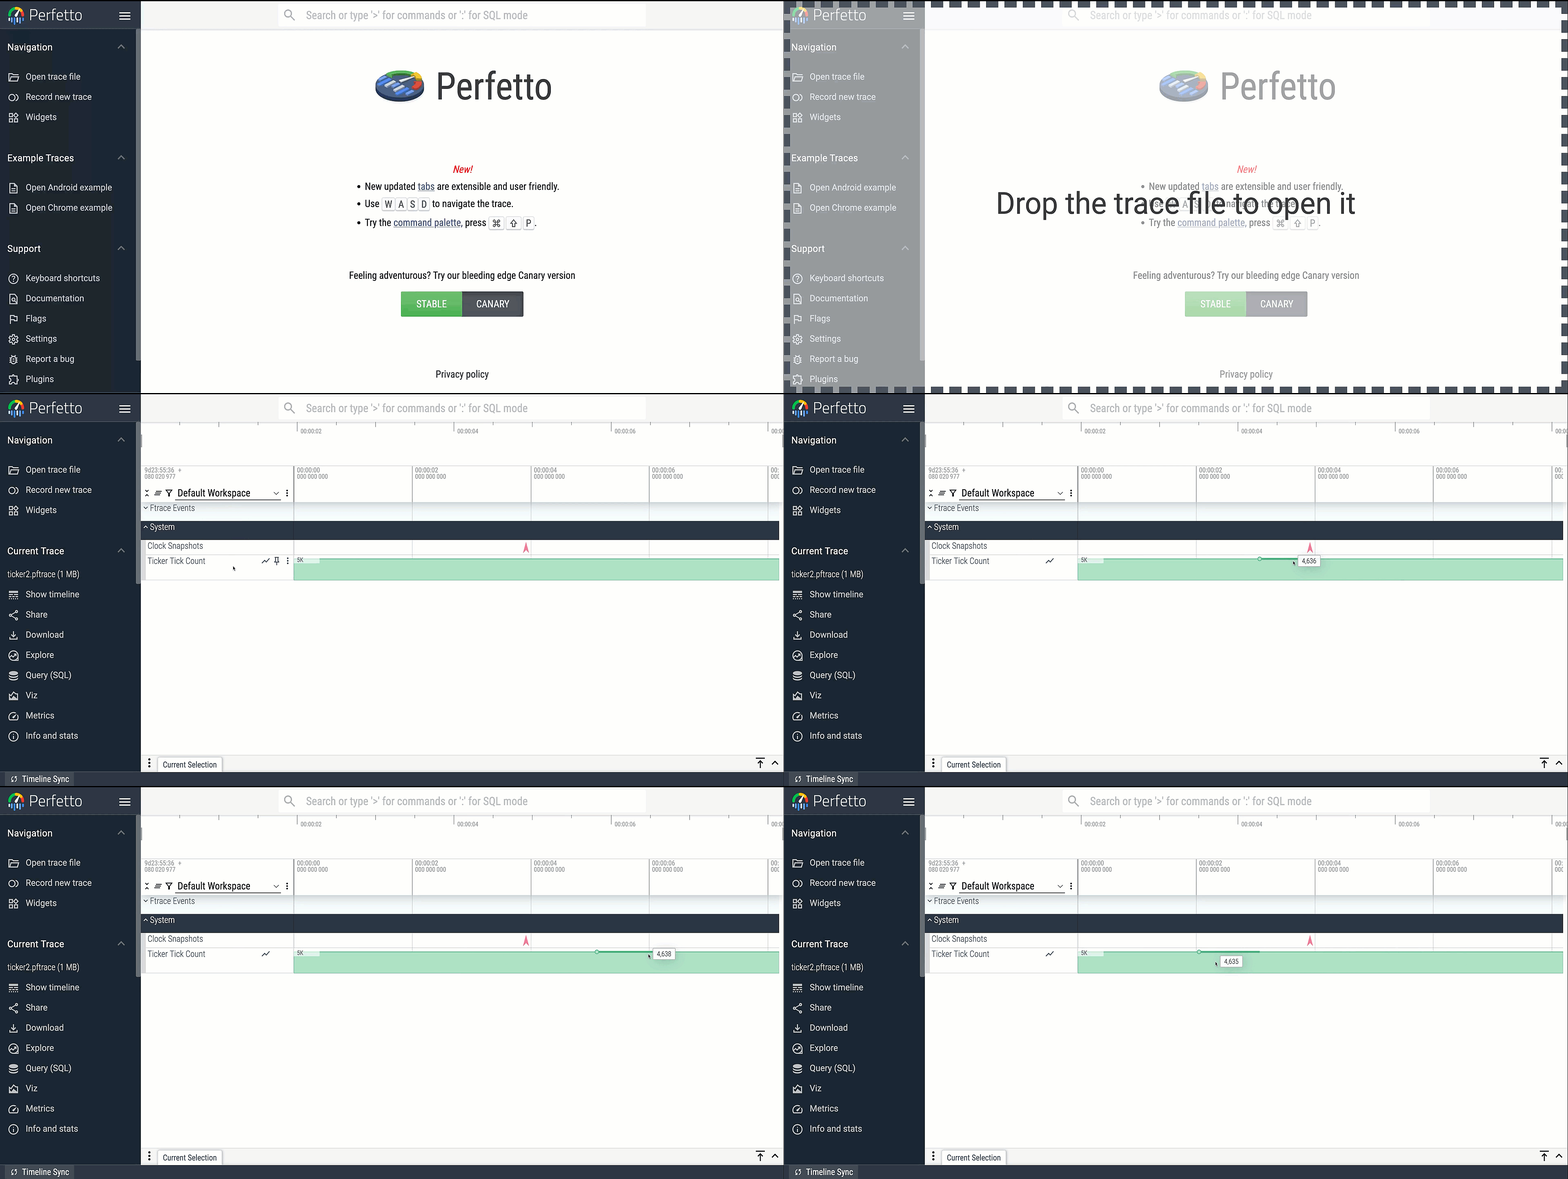
| Rebuild a local UI (`ui/run-dev-server`). Open the re-recorded trace (with the | |
| tracebox that had compile-time knowledge of the event). You should now see a | |
| dedicated UI track with your event's data. | |
|  | |
| This is the most complete way of adding ftrace events to the perfetto stack. | |
| There are quite a few steps and a need for upstreaming your changes, but this | |
| gives you full power to do arbitrary parsing in the trace\_processor code, and | |
| makes the results available to all users of perfetto. | |
| [ftrace-parser-link]: https://source.chromium.org/chromium/chromium/src/+/main:third_party/perfetto/src/trace_processor/importers/ftrace/ftrace_parser.cc?q=FtraceParser | |
| ## Part C: Simple slice/counter visualisations without modifying perfetto code (kernel track events) | |
| There is a simpler way for perfetto to automatically create basic slice & | |
| counter tracks from events, that is more suitable for people tinkering with a | |
| local kernel or writing a module that won't be upstreamed to the mainline | |
| kernel. This lets you focus on instrumenting your code instead of changing | |
| perfetto itself. | |
| Consider the case of slices, usually derived from a pair of events - one | |
| signifying the start of the slice, and the other ending it. There needs to be a | |
| convention for perfetto to know that a given tracepoint is to be interpreted | |
| this way. | |
| What perfetto does is look for specifically-named tracepoint fields | |
| (`TP_STRUCT__entry(..)` part of the definition). If your tracepoint matches this | |
| convention, trace\_processor and the UI will automatically try to group the | |
| events on tracks. With grouping (scoping) controlled by further conventions. | |
| The following sections give an example tracepoint template for a few common | |
| cases, and their expected visualisation: | |
| * slice tracks for synchronous code, where the operations are ended on the same | |
| thread that they're started, for example before and after a loop in a single | |
| function. | |
| * process-scoped slice tracks for events that are best visualised when grouped | |
| at the process level. | |
| * cpu-scoped counter tracks for events that represent per-cpu counters. | |
| NOTE: The full reference with details on scoping and track naming options is at | |
| ["Kernel track events: format and conventions"][trackevent-reference-link]. | |
| [trackevent-reference-link]: /docs/reference/kernel-track-event | |
| ### Thread-scoped slice tracks | |
| The simplest case if you want to visualise the duration of (potentially nested) | |
| regions of code where the beginning and the end happen on the same thread. | |
| Perfetto can be hinted that your tracepoint should be parsed into thread-scoped | |
| slice tracks simply by having two fields with "well known" names and types in | |
| the layout of the tracepoint (`TP_STRUCT__entry(...`): | |
| * `char track_event_type` | |
| * `__string slice_name` | |
| Perfetto will interpret the events as slices or instants based on the value of | |
| `track_event_type` in the actual timestamped event: | |
| * `'B'` opens a named slice (from `slice_name`) on the active thread. | |
| * `'E'` ends the last opened slice on the thread (`slice_name` is ignored). | |
| * `'I'` sets an instant (zero duration) event with the name taken from | |
| `slice_name`. | |
| The thread id and timestamp are implicitly part of every ftrace event already, | |
| and do not need to be specified. | |
| Tracepoint declaration example, named `trk_example/tid_track_example`: | |
| _Note: on kernels older than v6.10, \_\_assign_str requires two arguments, see | |
| [this patch](https://lore.kernel.org/linux-trace-kernel/20240516133454.681ba6a0@rorschach.local.home/)._ | |
| ```h | |
| // trace/events/trk_example.h | |
| #undef TRACE_SYSTEM | |
| #define TRACE_SYSTEM trk_example | |
| #if !defined(_TRACE_TRK_EXAMPLE_H_) || defined(TRACE_HEADER_MULTI_READ) | |
| #define _TRACE_TRK_EXAMPLE_H_ | |
| #include <linux/tracepoint.h> | |
| TRACE_EVENT(tid_track_example, | |
| TP_PROTO( | |
| char track_event_type, | |
| const char *slice_name | |
| ), | |
| TP_ARGS(track_event_type, slice_name), | |
| TP_STRUCT__entry( | |
| __field(char, track_event_type) | |
| __string(slice_name, slice_name) | |
| ), | |
| TP_fast_assign( | |
| __entry->track_event_type = track_event_type; | |
| /* kernels before v6.10: __assign_str(slice_name, slice_name) */ | |
| __assign_str(slice_name); | |
| ), | |
| TP_printk( | |
| "type=%c slice_name=%s", | |
| __entry->track_event_type, | |
| __get_str(slice_name) | |
| ) | |
| ); | |
| #endif | |
| /* This part must be outside protection */ | |
| #include <trace/define_trace.h> | |
| ``` | |
| Note that only the types and names of `TP_STRUCT__entry` matter, there are no | |
| constraints on extra fields, the printk specifier, or even field order. | |
| For convenience, the tracepoint invocations can be wrapped with macros: | |
| ```h | |
| // Convenience macros | |
| #define TRACE_EX_BEGIN(name) trace_tid_track_example('B', name) | |
| #define TRACE_EX_END() trace_tid_track_example('E', "") | |
| #define TRACE_EX_INSTANT(name) trace_tid_track_example('I', name) | |
| ``` | |
| Example of instrumented code, demonstrating nested slices and instants: | |
| ```c | |
| TRACE_EX_BEGIN("outer"); | |
| udelay(500); | |
| for (int i=0; i < 3; i++) { | |
| TRACE_EX_BEGIN("nested"); | |
| udelay(1000); | |
| TRACE_EX_INSTANT("instant"); | |
| TRACE_EX_END(); | |
| } | |
| TRACE_EX_END(); | |
| ``` | |
| We can record a trace with the following config (the | |
| `denser_generic_event_encoding` option is the default since perfetto v53, but | |
| is necessary on older versions): | |
| ``` | |
| // trace.txtpb | |
| duration_ms: 10000 | |
| buffers: { | |
| size_kb: 40960 | |
| fill_policy: DISCARD | |
| } | |
| data_sources: { | |
| config: { | |
| name: "linux.ftrace" | |
| ftrace_config: { | |
| denser_generic_event_encoding: true | |
| ftrace_events: "trk_example/*" | |
| } | |
| } | |
| } | |
| ``` | |
| Resulting tracks automatically derived by perfetto trace\_processor and UI. Note | |
| that each thread gets its own separate track, and the tracks are automatically | |
| nested under the process track group: | |
|  | |
| ### Process-scoped slice tracks | |
| Similar to the preceding example, but with slice events grouped at the process | |
| level. Note: this allows terminating slices from a different thread than which | |
| started the operation, but the grouped slices *must* have strict nesting - all | |
| slices must terminate before their parents (see the concept of [async | |
| slices][async-slice-link] for more details). | |
| [async-slice-link]: /docs/getting-started/converting#asynchronous-slices-and-overlapping-events | |
| The expected fields in `TP_STRUCT__entry` for this type of parsing: | |
| * `char track_event_type` | |
| * `__string slice_name` | |
| * `int scope_tgid` | |
| The first two fields are interpreted as in the preceding example, while the | |
| `scope_tgid` has to be populated with the process id (aka TGID) under which that | |
| particular event should be grouped. The process id should be real (don't | |
| hardcode arbitrary constants), but the emitting thread does not have to be in | |
| that process. | |
| Tracepoint declaration example, named `trk_example/tgid_track_example`: | |
| ```h | |
| // trace/events/trk_example.h | |
| #undef TRACE_SYSTEM | |
| #define TRACE_SYSTEM trk_example | |
| #if !defined(_TRACE_TRK_EXAMPLE_H_) || defined(TRACE_HEADER_MULTI_READ) | |
| #define _TRACE_TRK_EXAMPLE_H_ | |
| #include <linux/tracepoint.h> | |
| TRACE_EVENT(tgid_track_example, | |
| TP_PROTO( | |
| char track_event_type, | |
| const char *slice_name, | |
| int scope_tgid | |
| ), | |
| TP_ARGS(track_event_type, slice_name, scope_tgid), | |
| TP_STRUCT__entry( | |
| __field(char, track_event_type) | |
| __string(slice_name, slice_name) | |
| __field(int, scope_tgid) | |
| ), | |
| TP_fast_assign( | |
| __entry->track_event_type = track_event_type; | |
| /* kernels before v6.10: __assign_str(slice_name, slice_name) */ | |
| __assign_str(slice_name); | |
| __entry->scope_tgid = scope_tgid; | |
| ), | |
| TP_printk( | |
| "type=%c slice_name=%s tgid=%d", | |
| __entry->track_event_type, | |
| __get_str(slice_name), | |
| __entry->scope_tgid | |
| ) | |
| ); | |
| #endif | |
| /* This part must be outside protection */ | |
| #include <trace/define_trace.h> | |
| ``` | |
| Example convenience macros, using the current process context (`current->tgid`) | |
| for grouping events: | |
| ```h | |
| // Convenience macros | |
| #define TRACE_EX_BEGIN(name) trace_tgid_track_example('B', name, current->tgid) | |
| #define TRACE_EX_END() trace_tgid_track_example('E', "", current->tgid) | |
| #define TRACE_EX_INSTANT(name) trace_tgid_track_example('I', name, current->tgid) | |
| ``` | |
| Example of instrumented code, as before: | |
| ```c | |
| TRACE_EX_BEGIN("outer"); | |
| udelay(500); | |
| for (int i=0; i < 3; i++) { | |
| TRACE_EX_BEGIN("nested"); | |
| udelay(1000); | |
| TRACE_EX_INSTANT("instant"); | |
| TRACE_EX_END(); | |
| } | |
| TRACE_EX_END(); | |
| ``` | |
| Resulting visualisation, when recorded using the config from the preceding | |
| example. All slice stacks are aggregated at the process level: | |
|  | |
| ### CPU-scoped counter tracks | |
| Similarly to slices and instants, there is a convention for tracepoints to be | |
| automatically presented as tracks in perfetto. The counters can also be grouped | |
| by thread/process, but this example demonstrates per-cpu grouping. | |
| The expected fields in `TP_STRUCT__entry` for this type of parsing: | |
| * `u64 counter_value` (any intergral type is accepted) | |
| * `int scope_cpu` | |
| Tracepoint declaration example, named `trk_example/cpu_counter_example`: | |
| ```h | |
| // trace/events/trk_example.h | |
| #undef TRACE_SYSTEM | |
| #define TRACE_SYSTEM trk_example | |
| #if !defined(_TRACE_TRK_EXAMPLE_H_) || defined(TRACE_HEADER_MULTI_READ) | |
| #define _TRACE_TRK_EXAMPLE_H_ | |
| #include <linux/tracepoint.h> | |
| TRACE_EVENT(cpu_counter_example, | |
| TP_PROTO( | |
| u64 counter_value, | |
| int scope_cpu | |
| ), | |
| TP_ARGS(counter_value, scope_cpu), | |
| TP_STRUCT__entry( | |
| __field(u64, counter_value) | |
| __field(int, scope_cpu) | |
| ), | |
| TP_fast_assign( | |
| __entry->counter_value = counter_value; | |
| __entry->scope_cpu = scope_cpu; | |
| ), | |
| TP_printk( | |
| "counter_value=%llu cpu=%d", | |
| (unsigned long long)__entry->counter_value, | |
| __entry->scope_cpu | |
| ) | |
| ); | |
| #endif | |
| /* This part must be outside protection */ | |
| #include <trace/define_trace.h> | |
| ``` | |
| Example of instrumented code: | |
| ```c | |
| static unsigned int n = 0 | |
| trace_cpu_counter_example(n++, smp_processor_id()); | |
| ``` | |
| Resulting visualisation, when recorded using the config from the preceding | |
| examples. With counter increments being attributed to the cpu that executed the | |
| tracepoint (due to the use of `smp_processor_id()` as the cpu index, but we | |
| could've equally used a static index if that made more sense for the tracepoint | |
| in question): | |
|  | |