| Primiano Tucci | 8ab3cfa | 2018-08-21 17:49:30 +0200 | [diff] [blame] | 1 | # Trace Processor |
| 2 | |
| Lalit Maganti | cb45a21 | 2019-03-11 17:11:10 +0000 | [diff] [blame] | 3 | 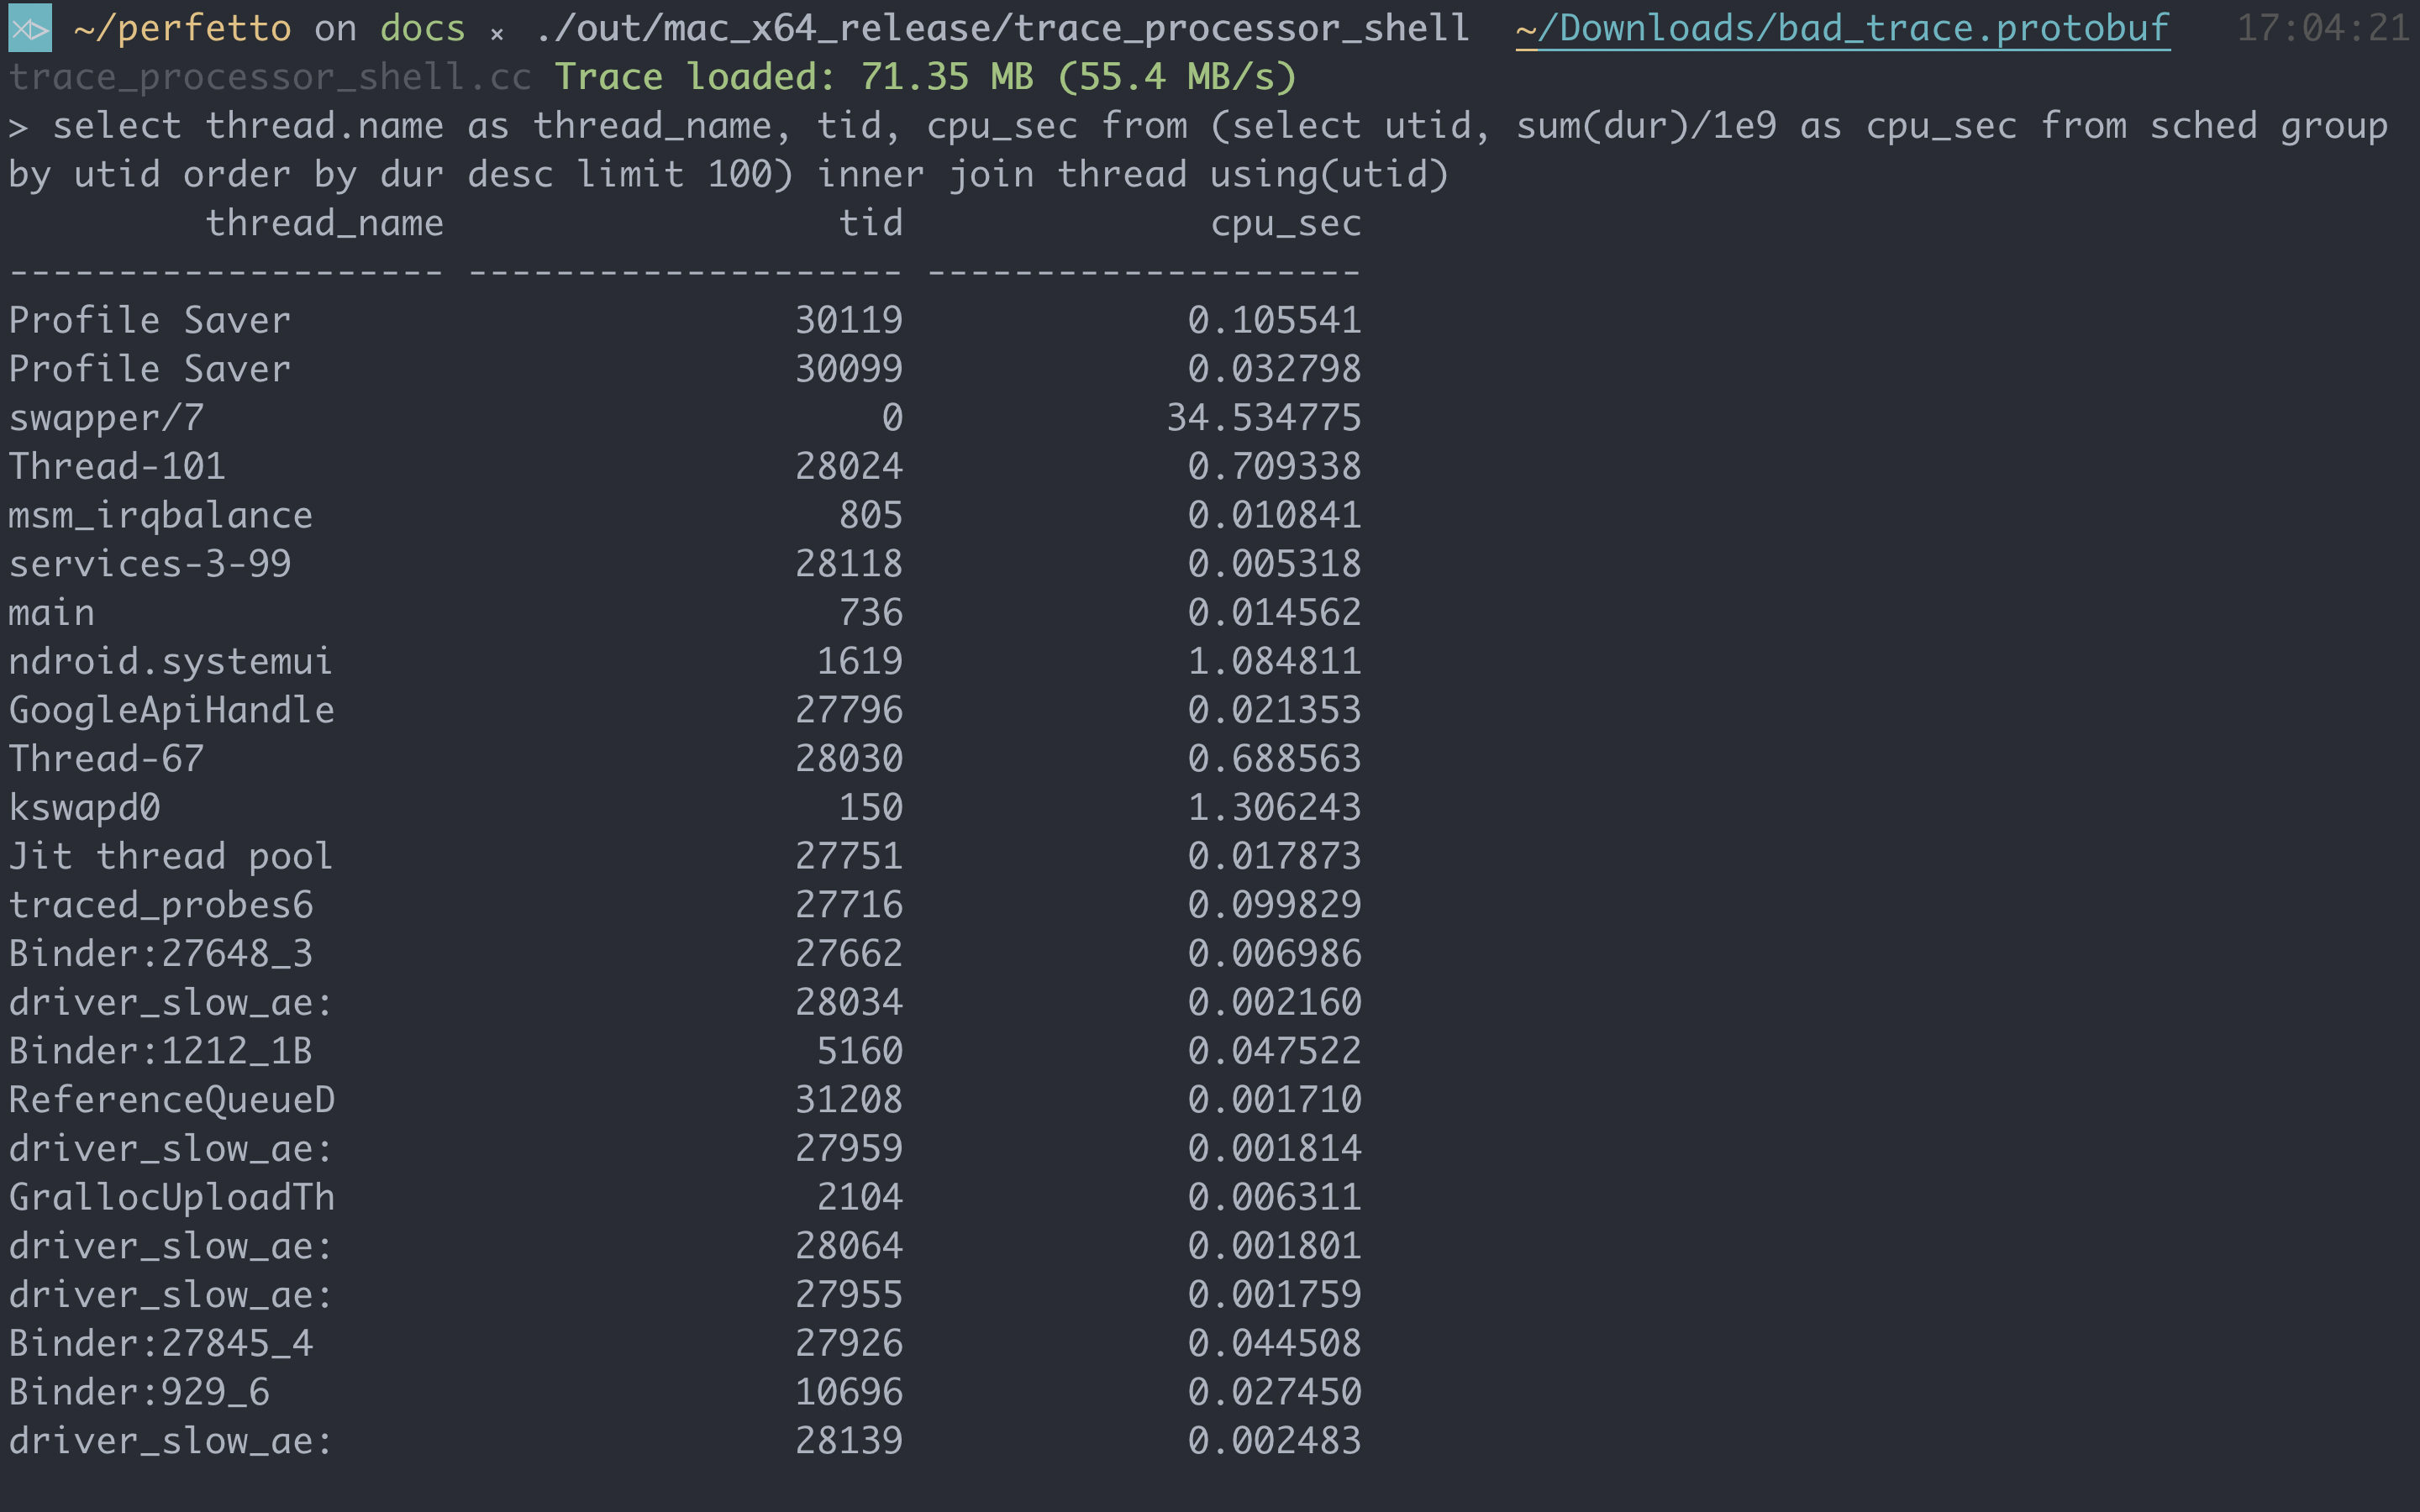 |
| 4 | |
| Primiano Tucci | 8ab3cfa | 2018-08-21 17:49:30 +0200 | [diff] [blame] | 5 | The Trace Processor is a C++ library |
| 6 | ([/src/trace_processor](/src/trace_processor)) that is able to ingest traces of |
| 7 | various format and expose them in a massaged, higher level format, queryable |
| 8 | through SQL queries. The trace processor is used: |
| 9 | * By the [Perfetto UI](https://ui.perfetto.dev/), in the form of a |
| 10 | Web Assembly module. |
| 11 | * Standalone, using the `trace_processor_shell` target |
| 12 | (`ninja -C out/xxx trace_processor_shell`). |
| 13 | * In internal google3 pipelines for batch processing. |
| 14 | |
| 15 | Supported input formats: |
| 16 | * Perfetto .proto traces |
| Lalit Maganti | cb45a21 | 2019-03-11 17:11:10 +0000 | [diff] [blame] | 17 | * [Partial support] Chrome .json trace events |
| Primiano Tucci | 8ab3cfa | 2018-08-21 17:49:30 +0200 | [diff] [blame] | 18 | * [NOT IMPLEMENTED YET] ftrace format as per `/sys/kernel/debug/tracing/trace`. |
| 19 | |
| 20 | 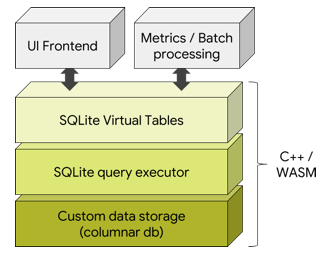 |
| 21 | |
| 22 | Rationale |
| 23 | --------- |
| 24 | Traces are raw because they are optimized for fast & low overhead writing. |
| 25 | Despite being protos, their output is not ideal for being consumed by third |
| 26 | parties as-is. Some data massaging is required. |
| 27 | Examples: |
| 28 | * Ftrace sched_switch events only provide thread names and thread IDs. |
| 29 | In order to attribute execution times to the package/process that data needs |
| 30 | to be joined with the process_tree events to join TIDs with their parent PID |
| 31 | and process name. |
| 32 | * Even after this join, sched_switch events produce two slices (one at the |
| 33 | beginning, one at the end) per sched event. What most consumers want to see |
| 34 | instead is one "interval" per thread execution time-slice. |
| 35 | * Similarly ftrace ext4 events provide only inode numbers and those need to be |
| 36 | joined with inode->path events. |
| 37 | |
| 38 | |
| 39 | Schema |
| 40 | ------ |
| 41 | |
| 42 | ### sched table |
| Lalit Maganti | cb45a21 | 2019-03-11 17:11:10 +0000 | [diff] [blame] | 43 | The sched table holds data about scheduling slices in the trace. |
| 44 | |
| Primiano Tucci | 8ab3cfa | 2018-08-21 17:49:30 +0200 | [diff] [blame] | 45 | `ts` |
| 46 | Timestamp of the scheduling event, in nanoseconds. This comes from the |
| 47 | CLOCK_BOOTTIME, when available. |
| 48 | |
| 49 | `dur` |
| 50 | Duration of the scheduling event, in nanoseconds. |
| 51 | |
| 52 | `utid` |
| 53 | ID of the thread. This is NOT the UNIX pid/tid (see below). |
| Lalit Maganti | cb45a21 | 2019-03-11 17:11:10 +0000 | [diff] [blame] | 54 | This can be joined with the thread table. |
| Primiano Tucci | 8ab3cfa | 2018-08-21 17:49:30 +0200 | [diff] [blame] | 55 | |
| 56 | `cpu` |
| 57 | CPU number where the scheduling event happened. |
| 58 | |
| Lalit Maganti | cb45a21 | 2019-03-11 17:11:10 +0000 | [diff] [blame] | 59 | |
| 60 | ### counters table |
| 61 | The counters table contains the data about counter events (both kernel |
| 62 | and userspace) in the trace. This includes sources like memory, battery, |
| 63 | cpufreq events etc. |
| 64 | |
| 65 | `id` |
| 66 | A unique identifier for the counter row. |
| 67 | |
| 68 | `ts` |
| 69 | The timestamp of the counter event. |
| 70 | |
| 71 | `name` |
| 72 | The name of the counter event. |
| 73 | |
| 74 | `value` |
| 75 | The value of the counter event. |
| 76 | |
| 77 | `ref` |
| 78 | The identifier of the `ref`erence metadata associated with the counter event. |
| 79 | See ref_type for what data this can contain. |
| 80 | |
| 81 | `ref_type` |
| 82 | The type of reference metadata associated to the counter event. Will be one |
| 83 | of the following values `utid` (the ref is an identifier for the thread table), |
| 84 | `upid` (same for process table), `cpu` (the cpu the event occurred on), `irq` |
| 85 | and `softirq`. |
| 86 | |
| 87 | `arg_set_id` |
| 88 | The identifier into the args table. (see below) |
| 89 | |
| 90 | |
| 91 | ### instants table |
| 92 | The instants table contains the data about instant events (both kernel |
| 93 | and userspace) in the trace. This includes sources like the lmk, sched_wakeup |
| 94 | events etc. |
| 95 | |
| 96 | `id` |
| 97 | A unique identifier for the instant row. |
| 98 | |
| 99 | `ts` |
| 100 | The timestamp of the instant event. |
| 101 | |
| 102 | `name` |
| 103 | The name of the instant event. |
| 104 | |
| 105 | 'value' |
| 106 | The value of the instant event. |
| 107 | |
| 108 | `ref` |
| 109 | The identifier of the `ref`erence metadata associated with the instant event. |
| 110 | See ref_type for what data this can contain. |
| 111 | |
| 112 | `ref_type` |
| 113 | The type of reference metadata associated to the instant event. Will be one |
| 114 | of the following values `utid` (the ref is an identifier for the thread table), |
| 115 | `upid` (same for process table), `cpu` (the cpu the event occurred on), `irq` |
| 116 | and `softirq`. |
| 117 | |
| 118 | `arg_set_id` |
| 119 | The identifier into the args table. (see below) |
| 120 | |
| 121 | |
| 122 | ### slices table |
| 123 | The slices table holds data about the userspace slices (from Chrome or Android) |
| 124 | seen in the trace. These slices can be nested within each other forming 'stacks' |
| 125 | of slices. |
| 126 | |
| 127 | `ts` |
| 128 | The timestamp of the userspace slice in nanoseconds. |
| 129 | |
| 130 | `dur` |
| 131 | Duration of the userspace slice, in nanoseconds. |
| 132 | |
| 133 | `utid` |
| 134 | ID of the thread. This is NOT the UNIX pid/tid (see below). |
| 135 | This can be joined with the thread table. |
| 136 | |
| 137 | `cat` |
| 138 | The category of the slice. Only non-null and meaningful for Chrome traces. |
| 139 | |
| 140 | `name` |
| 141 | The name of the slice. |
| 142 | |
| 143 | `depth` |
| 144 | The nesting depth of the slice within the stack. Starts at 0 for root slices |
| 145 | and counts upward for child slices. |
| 146 | |
| 147 | `stack_id` |
| 148 | A unique identifier for the whole stack of slices to the current point. This |
| 149 | identifier is useful when deriving metrics on unique stacks of slices. |
| 150 | |
| 151 | `parent_stack_id` |
| 152 | The 'stack_id' for the parent stack of slices. This is 0 for all root slices |
| 153 | and a reference to a 'stack_id' otherwise. |
| Primiano Tucci | 8ab3cfa | 2018-08-21 17:49:30 +0200 | [diff] [blame] | 154 | |
| 155 | |
| 156 | ### process table |
| Lalit Maganti | cb45a21 | 2019-03-11 17:11:10 +0000 | [diff] [blame] | 157 | The process table holds data about the processes seen in the trace. |
| 158 | |
| Primiano Tucci | 8ab3cfa | 2018-08-21 17:49:30 +0200 | [diff] [blame] | 159 | `upid` |
| 160 | Unique process ID. This is NOT the UNIX pid. This is a sequence number generated |
| 161 | by the trace processor to uniquely identify a process in the trace. This is to |
| 162 | deal with the fact that UNIX pids can be recycled and two distinct processes |
| 163 | which lifetimes don't overlap can be assigned the same pid. |
| 164 | |
| 165 | `name` |
| 166 | Process name, as per /proc/pid/cmdline. |
| 167 | |
| 168 | `pid` |
| 169 | The UNIX pid (also known as Thread Group ID in Linux). This also matches the |
| 170 | tid of the process' main thread. |
| 171 | |
| 172 | |
| 173 | Example: |
| 174 | |
| 175 | | upid | name | pid | |
| 176 | |-------------------|--------------------|--------------------| |
| 177 | | 1 | /system/bin/logd | 601 | |
| 178 | | 2 | rcu_preempt | 7 | |
| 179 | | 3 | rcuop/4 | 44 | |
| 180 | | 4 | rcuop/6 | 60 | |
| 181 | |
| 182 | ### thread table |
| Lalit Maganti | cb45a21 | 2019-03-11 17:11:10 +0000 | [diff] [blame] | 183 | The thread table holds data about the threads seen in the trace. |
| 184 | |
| Primiano Tucci | 8ab3cfa | 2018-08-21 17:49:30 +0200 | [diff] [blame] | 185 | `utid` |
| 186 | Unique thread ID. This is NOT the Linux pid or tid. Like the above, this is a |
| 187 | sequence number generated by the trace processor to uniquely identify a thread |
| 188 | in the trace. |
| 189 | |
| 190 | `upid` |
| 191 | ID of the parent process in the `process` table. |
| 192 | This can be used to JOIN a thread with its process. |
| 193 | |
| 194 | `name` |
| Lalit Maganti | cb45a21 | 2019-03-11 17:11:10 +0000 | [diff] [blame] | 195 | Thread name, as per /proc/pid/task/tid/comm. |
| Primiano Tucci | 8ab3cfa | 2018-08-21 17:49:30 +0200 | [diff] [blame] | 196 | |
| 197 | `tid` |
| 198 | The Linux thread id (confusingly named "pid" in the Linux-world). |
| 199 | For the process' main thread `tid` == `tgid` == `pid`. |
| 200 | |
| 201 | Example: |
| 202 | |
| 203 | | utid | upid | name | tid | |
| 204 | |--------|-------|------------------|------| |
| 205 | | 1 | 1 | logd.klogd | 632 | |
| 206 | | 2 | 2 | rcu_preempt | 7 | |
| 207 | | 3 | 4 | rcuop/6 | 60 | |
| 208 | | 4 | 6 | rcuop/3 | 36 | |
| 209 | | 5 | 8 | sugov:0 | 588 | |
| 210 | | 6 | 9 | kworker/u16:6 | 9283 | |
| 211 | | 7 | 12 | sensors@1.0-ser | 1021 | |
| 212 | | 8 | 12 | HwBinder:797_1 | 1626 | |
| 213 | |
| 214 | |
| Lalit Maganti | cb45a21 | 2019-03-11 17:11:10 +0000 | [diff] [blame] | 215 | ### stats table |
| 216 | The stats table holds the statistics from the trace collection tool |
| 217 | as well as counters from the trace processor collected during parsing and |
| 218 | ingesting the trace |
| 219 | |
| 220 | `name` |
| 221 | The name of the stat. |
| 222 | |
| 223 | `idx` |
| 224 | The index of the stat in the array. This value is only non-null for |
| 225 | stats which are indexed (e.g. ftrace overrun events are indexed per CPU). |
| 226 | |
| 227 | `severity` |
| 228 | The severity of the value indicated by the stat. Can be one of 'info' and |
| 229 | 'error'. |
| 230 | |
| 231 | `source` |
| 232 | The source of the stat i.e. whether is is coming from the trace collection |
| 233 | time or parsing/ingestion time. One of 'trace' (i.e. trace collection time) |
| 234 | or 'analysis' (parsing/ingestion time). |
| 235 | |
| 236 | `value` |
| 237 | The value of the statistic. |
| 238 | |
| 239 | |
| 240 | ### args table |
| 241 | The args table is a generic store of key value pairs deduplicated across the |
| 242 | entire trace. A 'set' of arguments is given a unique identifier and can be |
| 243 | referenced from other tables. |
| 244 | |
| 245 | `arg_set_id` |
| 246 | The identifier for the set of arguments this arg belongs to. |
| 247 | |
| 248 | `flat_key` |
| 249 | The key of the arg excluding any indexing for args which are arrays. |
| 250 | |
| 251 | `key` |
| 252 | The long form key of the arg (including any indexes for array args.) |
| 253 | |
| 254 | `int_value`, `real_value`, `string_value` |
| 255 | The value of the arg. One of these columns will be non-null depending on the |
| 256 | type of the arg with the other two being null. |
| 257 | |
| 258 | |
| Primiano Tucci | 8ab3cfa | 2018-08-21 17:49:30 +0200 | [diff] [blame] | 259 | Sample queries for the `sched` (sched_switch events) table |
| 260 | ---------------------------------------------------------- |
| 261 | |
| 262 | ### Trace duration |
| 263 | ``` sql |
| 264 | select ((select max(ts) from sched) - (select min(ts) from sched)) / 1e9 as duration_sec |
| 265 | ``` |
| 266 | |
| 267 | ### Total CPU usage |
| 268 | ``` sql |
| 269 | select cpu, sum(dur)/1e9 as cpu_time_sec from sched group by cpu order by cpu |
| 270 | ``` |
| 271 | |
| 272 | ### List all processes |
| 273 | ``` sql |
| 274 | select process.name, pid from process limit 100 |
| 275 | ``` |
| 276 | |
| 277 | ### List all processes and threads |
| 278 | ``` sql |
| 279 | select process.name as proc_name, pid, thread.name as thread_name, tid from thread left join process using(upid) limit 100 |
| 280 | ``` |
| 281 | |
| 282 | ### CPU time for top 100 threads |
| 283 | ``` sql |
| 284 | select thread.name as thread_name, tid, cpu_sec from (select utid, sum(dur)/1e9 as cpu_sec from sched group by utid order by dur desc limit 100) inner join thread using(utid) |
| 285 | ``` |
| 286 | |
| 287 | With matching process names |
| 288 | ``` sql |
| 289 | select thread.name as thread_name, process.name as proc_name, tid, pid, cpu_sec from (select utid, sum(dur)/1e9 as cpu_sec from sched group by utid order by dur desc limit 100) left outer join thread using(utid) left outer join process using(upid) |
| 290 | ``` |
| 291 | |
| 292 | ### CPU time for top 100 processes |
| 293 | ``` sql |
| Hector Dearman | 59fc2ae | 2018-09-18 10:30:59 +0100 | [diff] [blame] | 294 | select process.name, tot_proc/1e9 as cpu_sec from (select upid, sum(tot_thd) as |
| 295 | tot_proc from (select utid, sum(dur) as tot_thd from sched group by utid) join |
| 296 | thread using(utid) group by upid) join process using(upid) order by cpu_sec desc |
| 297 | limit 100; |
| Primiano Tucci | 8ab3cfa | 2018-08-21 17:49:30 +0200 | [diff] [blame] | 298 | ``` |
| 299 | |
| 300 | ### CPU time for top 100 processes broken down by cpu |
| 301 | ``` sql |
| 302 | select proc_name, cpu, cpu_sec from (select process.name as proc_name, upid, cpu, cpu_sec from (select cpu, utid, sum(dur)/1e9 as cpu_sec from sched group by utid) left join thread using(utid) left join process using(upid)) group by upid, cpu order by cpu_sec desc limit 100 |
| 303 | ``` |